| Param | Original file | Final file |
|---|---|---|
| Filename | modeM0/AS1A03_052T01_9000001208cztM0_level2_bc.evt | modeM0/AS1A03_052T01_9000001208cztM0_level2_quad_clean.evt |
| Size (bytes) | 1,825,009,920 | 689,448,960 |
| Size | 1.7 GB | 657.5 MB |
| Events in quadrant A | 11,936,460 | 4,202,937 |
| Events in quadrant B | 12,367,197 | 4,329,420 |
| Events in quadrant C | 11,273,449 | 4,335,723 |
| Events in quadrant D | 15,806,546 | 4,107,698 |
| Mode M9 | |||
|---|---|---|---|
| Quadrant | BADHDUFLAG | Total packets | Discarded packets |
| A | 0 | 97 | 0 |
| B | 0 | 97 | 0 |
| C | 0 | 97 | 0 |
| D | 0 | 98 | 0 |
| Mode SS | |||
|---|---|---|---|
| Quadrant | BADHDUFLAG | Total packets | Discarded packets |
| A | 0 | 1164 | 0 |
| B | 0 | 1162 | 0 |
| C | 0 | 1161 | 0 |
| D | 0 | 1169 | 0 |
| Mode M0 | |||
|---|---|---|---|
| Quadrant | BADHDUFLAG | Total packets | Discarded packets |
| A | 0 | 119461 | 0 |
| B | 0 | 122322 | 0 |
| C | 0 | 117636 | 0 |
| D | 0 | 133492 | 0 |
| Quadrant | Total seconds | Saturated seconds | Saturation percentage |
|---|---|---|---|
| A | 56881 | 873 | 1.534783% |
| B | 56883 | 1232 | 2.165849% |
| C | 56995 | 545 | 0.956224% |
| D | 56875 | 1600 | 2.813187% |
Noise dominated data is calculated using 1-second bins in cleaned event files. If a bin has >2000 counts, and if more than 50% of those come from <1% of pixels, then it is considered to be noise-dominated and hence unusable.
| Quadrant | # 1 sec bins | Bins with >0 counts | Bins with >2000 counts | High rate bins dominated by noise | Noise dominated (total time) | Noise dominated (detector-on time) | Marked lightcurve |
|---|---|---|---|---|---|---|---|
| A | 74209 | 57960 | 22 | 22 | 0.03% | 0.04% |  |
| B | 74209 | 57929 | 49 | 49 | 0.07% | 0.08% |  |
| C | 74209 | 58033 | 1 | 1 | 0.00% | 0.00% |  |
| D | 74206 | 57921 | 219 | 219 | 0.30% | 0.38% | 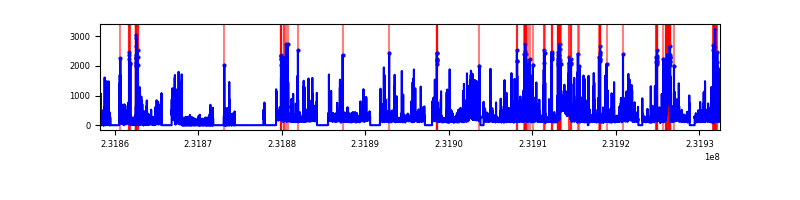 |
Top three noisy pixels from each quadrant. If the there are fewer than three noisy pixels in the level2.evt file, extra rows are filled as -1
| Pixel properties | Quadrant properties | ||||||
|---|---|---|---|---|---|---|---|
| Quadrant | DetID | PixID | Counts | Sigma | Mean | Median | Sigma |
| A | 13 | 251 | 598558 | 970.36 | 2809 | 2746 | 614.0 |
| A | 0 | 254 | 160461 | 256.86 | 2809 | 2746 | 614.0 |
| A | 15 | 236 | 151794 | 242.74 | 2809 | 2746 | 614.0 |
| B | 10 | 16 | 893502 | 1637.59 | 2867 | 2784 | 543.9 |
| B | 4 | 173 | 123117 | 221.23 | 2867 | 2784 | 543.9 |
| B | 5 | 255 | 76756 | 136.0 | 2867 | 2784 | 543.9 |
| C | 14 | 234 | 58648 | 88.75 | 2837 | 2793 | 629.3 |
| C | 12 | 4 | 30817 | 44.53 | 2837 | 2793 | 629.3 |
| C | 8 | 222 | 25727 | 36.44 | 2837 | 2793 | 629.3 |
| D | 1 | 52 | 2928791 | 4332.26 | 2766 | 2678 | 675.4 |
| D | 7 | 71 | 998962 | 1475.05 | 2766 | 2678 | 675.4 |
| D | 9 | 64 | 273630 | 401.16 | 2766 | 2678 | 675.4 |
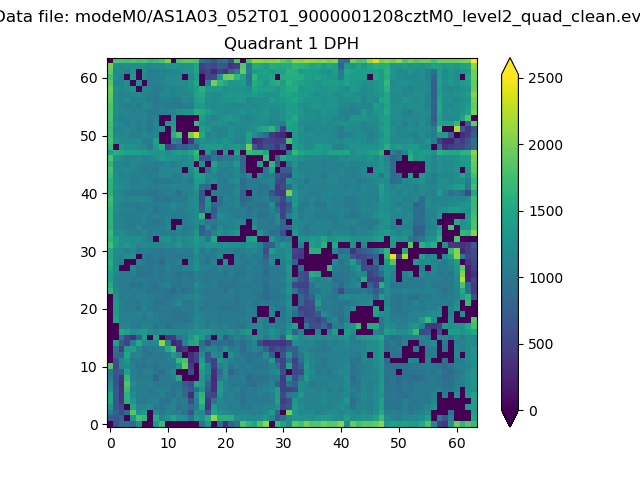
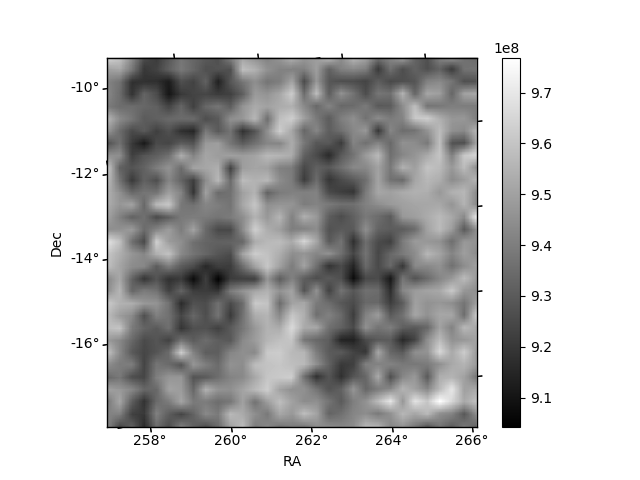
Histogram calculated using DETX and DETY for each event in the final _common_clean file
| Quadrant A |  |
 |
Quadrant B |
|---|---|---|---|
| Quadrant D |  |
 |
Quadrant C |
| Plot type | Count rate plots | Images |
|---|---|---|
| Comparison with Poisson distribution Blue bars denote a histogram of data divided into 1 sec bins. Red curve is a Poisson curve with rate = median count rate of data. |
 |
 |
| Quadrant-wise count rates Data is divided into 100 sec bins |
 |
|
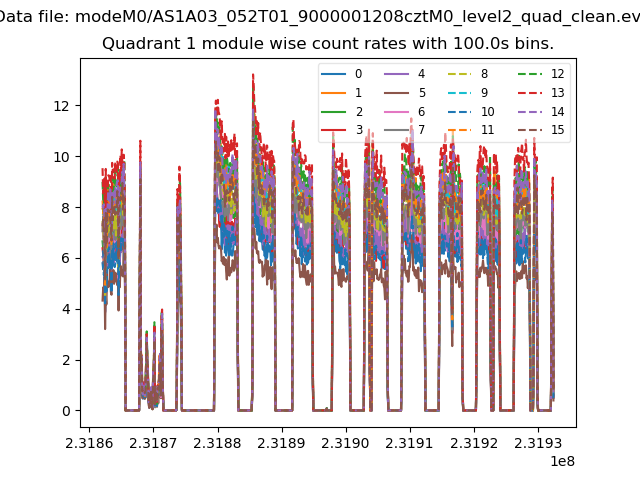
| Module-wise count rates for Quadrant A Data is divided into 100 sec bins |
 |
 |
| Module-wise count rates for Quadrant B Data is divided into 100 sec bins |
 |
 |
| Module-wise count rates for Quadrant C Data is divided into 100 sec bins |
 |
 |
| Module-wise count rates for Quadrant D Data is divided into 100 sec bins |
 |
 |
| Parameter | Plot |
|---|---|
| CZT HV Monitor |  |
| D_VDD | 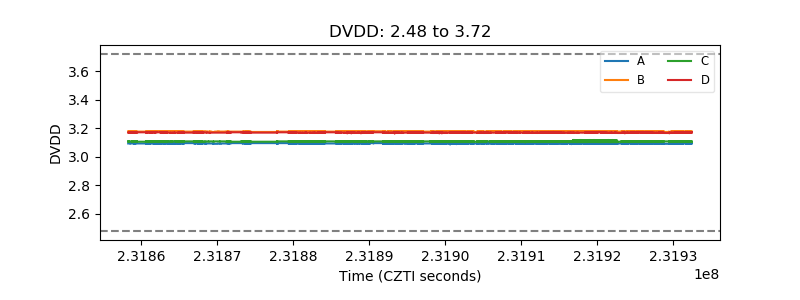 |
| Temperature 1 |  |
| Veto HV Monitor |  |
| Veto LLD |  |
| Alpha Counter | 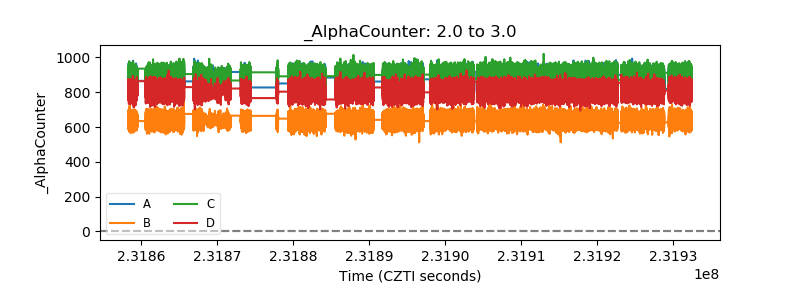 |
| _CPM_Rate | 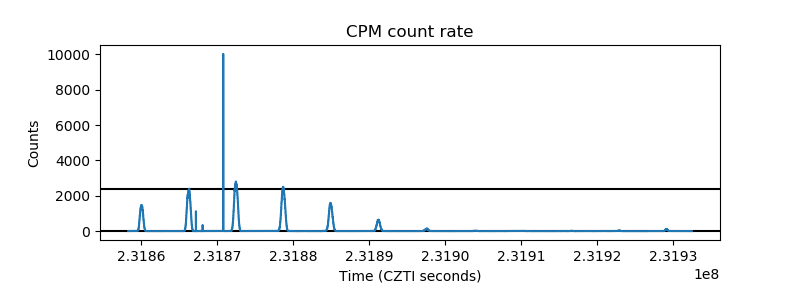 |
| CZT Counter |  |
| +2.5 Volts monitor |  |
| +5 Volts monitor |  |
| _ROLL_ROT |  |
| _Roll_DEC | 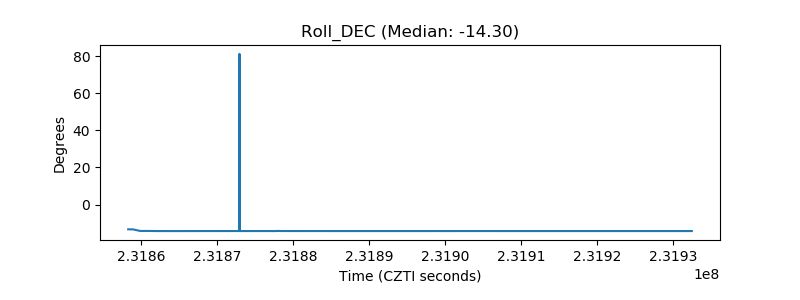 |
| _Roll_RA |  |
| Veto Counter |  |