| Param | Original file | Final file |
|---|---|---|
| Filename | modeM0/AS1A03_036T01_9000001204cztM0_level2.evt | modeM0/AS1A03_036T01_9000001204cztM0_level2_quad_clean.evt |
| Size (bytes) | 3,891,556,800 | 781,632,000 |
| Size | 3.6 GB | 745.4 MB |
| Events in quadrant A | 26,653,849 | 4,970,714 |
| Events in quadrant B | 31,320,709 | 5,049,398 |
| Events in quadrant C | 25,681,247 | 4,963,088 |
| Events in quadrant D | 30,270,836 | 4,701,130 |
| Mode M0 | |||
|---|---|---|---|
| Quadrant | BADHDUFLAG | Total packets | Discarded packets |
| A | 0 | 120646 | 0 |
| B | 0 | 132009 | 0 |
| C | 0 | 118821 | 0 |
| D | 0 | 132215 | 0 |
| Mode SS | |||
|---|---|---|---|
| Quadrant | BADHDUFLAG | Total packets | Discarded packets |
| A | 0 | 1186 | 0 |
| B | 0 | 1186 | 0 |
| C | 0 | 1186 | 0 |
| D | 0 | 1186 | 0 |
| Mode M9 | |||
|---|---|---|---|
| Quadrant | BADHDUFLAG | Total packets | Discarded packets |
| A | 0 | 76 | 0 |
| B | 0 | 76 | 0 |
| C | 0 | 76 | 0 |
| D | 0 | 77 | 0 |
| Quadrant | Total seconds | Saturated seconds | Saturation percentage |
|---|---|---|---|
| A | 58158 | 792 | 1.361807% |
| B | 58163 | 1708 | 2.936575% |
| C | 58174 | 474 | 0.814797% |
| D | 58177 | 1576 | 2.708974% |
Noise dominated data is calculated using 1-second bins in cleaned event files. If a bin has >2000 counts, and if more than 50% of those come from <1% of pixels, then it is considered to be noise-dominated and hence unusable.
| Quadrant | # 1 sec bins | Bins with >0 counts | Bins with >2000 counts | High rate bins dominated by noise | Noise dominated (total time) | Noise dominated (detector-on time) | Marked lightcurve |
|---|---|---|---|---|---|---|---|
| A | 66045 | 58209 | 55 | 55 | 0.08% | 0.09% |  |
| B | 66045 | 58211 | 705 | 705 | 1.07% | 1.21% |  |
| C | 66045 | 58216 | 0 | 0 | 0.00% | 0.00% | 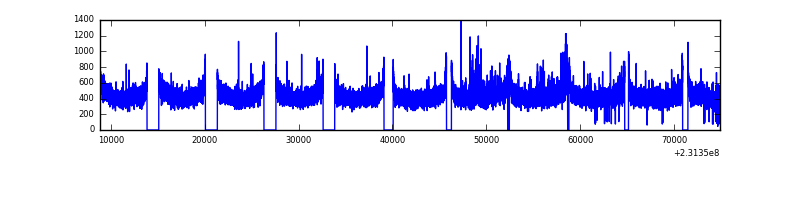 |
| D | 66045 | 58210 | 758 | 758 | 1.15% | 1.30% | 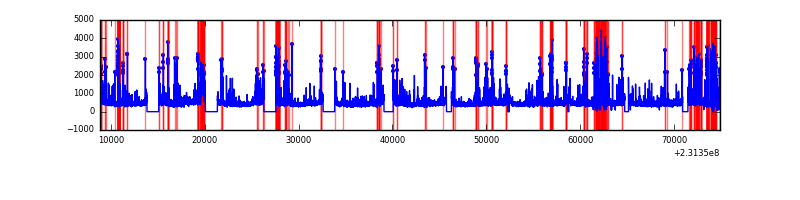 |
Top three noisy pixels from each quadrant. If the there are fewer than three noisy pixels in the level2.evt file, extra rows are filled as -1
| Pixel properties | Quadrant properties | ||||||
|---|---|---|---|---|---|---|---|
| Quadrant | DetID | PixID | Counts | Sigma | Mean | Median | Sigma |
| A | 8 | 5 | 411829 | 304.33 | 6629 | 6474 | 1331.9 |
| A | 15 | 174 | 197650 | 143.53 | 6629 | 6474 | 1331.9 |
| A | 15 | 63 | 184741 | 133.84 | 6629 | 6474 | 1331.9 |
| B | 10 | 16 | 2615325 | 2092.01 | 6681 | 6528 | 1247.0 |
| B | 0 | 214 | 938136 | 747.06 | 6681 | 6528 | 1247.0 |
| B | 10 | 246 | 541386 | 428.91 | 6681 | 6528 | 1247.0 |
| C | 14 | 64 | 217291 | 141.42 | 6508 | 6525 | 1490.3 |
| C | 13 | 61 | 49269 | 28.68 | 6508 | 6525 | 1490.3 |
| C | 8 | 222 | 38565 | 21.5 | 6508 | 6525 | 1490.3 |
| D | 10 | 253 | 1700599 | 998.23 | 6360 | 6229 | 1697.4 |
| D | 2 | 136 | 962292 | 563.26 | 6360 | 6229 | 1697.4 |
| D | 13 | 137 | 739913 | 432.25 | 6360 | 6229 | 1697.4 |
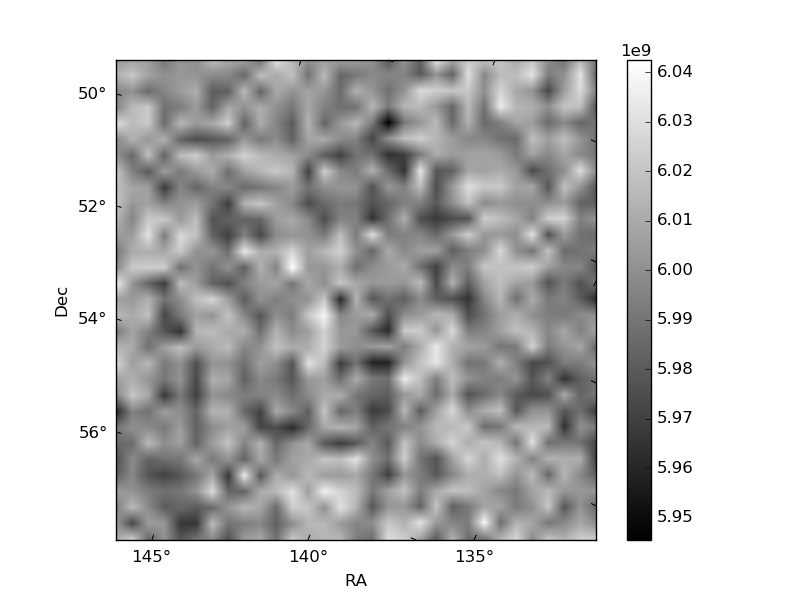
Histogram calculated using DETX and DETY for each event in the final _common_clean file
| Quadrant A |  |
 |
Quadrant B |
|---|---|---|---|
| Quadrant D |  |
 |
Quadrant C |
| Plot type | Count rate plots | Images |
|---|---|---|
| Comparison with Poisson distribution Blue bars denote a histogram of data divided into 1 sec bins. Red curve is a Poisson curve with rate = median count rate of data. |
 |
 |
| Quadrant-wise count rates Data is divided into 100 sec bins |
 |
|
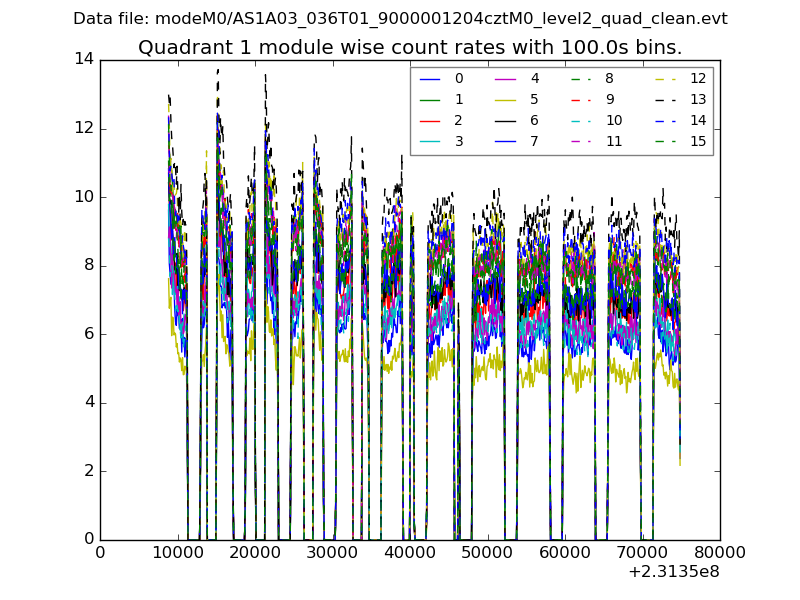
| Module-wise count rates for Quadrant A Data is divided into 100 sec bins |
 |
 |
| Module-wise count rates for Quadrant B Data is divided into 100 sec bins |
 |
 |
| Module-wise count rates for Quadrant C Data is divided into 100 sec bins |
 |
 |
| Module-wise count rates for Quadrant D Data is divided into 100 sec bins |
 |
 |
| Parameter | Plot |
|---|---|
| CZT HV Monitor |  |
| D_VDD |  |
| Temperature 1 |  |
| Veto HV Monitor |  |
| Veto LLD |  |
| Alpha Counter |  |
| _CPM_Rate |  |
| CZT Counter |  |
| +2.5 Volts monitor |  |
| +5 Volts monitor |  |
| _ROLL_ROT | 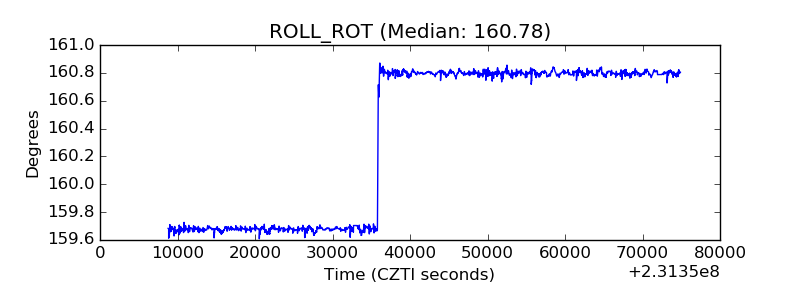 |
| _Roll_DEC |  |
| _Roll_RA |  |
| Veto Counter |  |