| Param | Original file | Final file |
|---|---|---|
| Filename | modeM0/AS1A03_102T01_9000001202cztM0_level2.evt | modeM0/AS1A03_102T01_9000001202cztM0_level2_quad_clean.evt |
| Size (bytes) | 10,914,598,080 | 2,656,552,320 |
| Size | 10.2 GB | 2.5 GB |
| Events in quadrant A | 78,800,699 | 17,264,054 |
| Events in quadrant B | 84,489,132 | 17,802,624 |
| Events in quadrant C | 72,447,796 | 17,434,851 |
| Events in quadrant D | 83,604,613 | 16,597,405 |
| Mode M9 | |||
|---|---|---|---|
| Quadrant | BADHDUFLAG | Total packets | Discarded packets |
| A | 0 | 247 | 0 |
| B | 0 | 247 | 0 |
| C | 0 | 247 | 0 |
| D | 0 | 248 | 0 |
| Mode SS | |||
|---|---|---|---|
| Quadrant | BADHDUFLAG | Total packets | Discarded packets |
| A | 0 | 3384 | 0 |
| B | 0 | 3382 | 0 |
| C | 0 | 3384 | 0 |
| D | 0 | 3380 | 0 |
| Mode M0 | |||
|---|---|---|---|
| Quadrant | BADHDUFLAG | Total packets | Discarded packets |
| A | 0 | 353064 | 0 |
| B | 0 | 363777 | 0 |
| C | 0 | 338081 | 0 |
| D | 0 | 370334 | 0 |
| Quadrant | Total seconds | Saturated seconds | Saturation percentage |
|---|---|---|---|
| A | 166024 | 2916 | 1.756373% |
| B | 166021 | 3112 | 1.874462% |
| C | 166031 | 1300 | 0.782986% |
| D | 166026 | 3712 | 2.235794% |
Noise dominated data is calculated using 1-second bins in cleaned event files. If a bin has >2000 counts, and if more than 50% of those come from <1% of pixels, then it is considered to be noise-dominated and hence unusable.
| Quadrant | # 1 sec bins | Bins with >0 counts | Bins with >2000 counts | High rate bins dominated by noise | Noise dominated (total time) | Noise dominated (detector-on time) | Marked lightcurve |
|---|---|---|---|---|---|---|---|
| A | 194880 | 166076 | 770 | 770 | 0.40% | 0.46% |  |
| B | 194880 | 166070 | 815 | 815 | 0.42% | 0.49% |  |
| C | 194880 | 166080 | 4 | 4 | 0.00% | 0.00% |  |
| D | 194880 | 166075 | 2188 | 2188 | 1.12% | 1.32% |  |
Top three noisy pixels from each quadrant. If the there are fewer than three noisy pixels in the level2.evt file, extra rows are filled as -1
| Pixel properties | Quadrant properties | ||||||
|---|---|---|---|---|---|---|---|
| Quadrant | DetID | PixID | Counts | Sigma | Mean | Median | Sigma |
| A | 15 | 223 | 1891470 | 500.2 | 18785 | 18368 | 3744.7 |
| A | 13 | 248 | 1369533 | 360.82 | 18785 | 18368 | 3744.7 |
| A | 5 | 16 | 1096771 | 287.98 | 18785 | 18368 | 3744.7 |
| B | 0 | 214 | 2367754 | 662.38 | 19065 | 18605 | 3546.5 |
| B | 10 | 16 | 2164144 | 604.97 | 19065 | 18605 | 3546.5 |
| B | 5 | 255 | 1209258 | 335.72 | 19065 | 18605 | 3546.5 |
| C | 13 | 61 | 141032 | 28.99 | 18479 | 18526 | 4226.1 |
| C | 14 | 67 | 112344 | 22.2 | 18479 | 18526 | 4226.1 |
| C | 8 | 222 | 101409 | 19.61 | 18479 | 18526 | 4226.1 |
| D | 12 | 233 | 2475669 | 510.85 | 18144 | 17725 | 4811.5 |
| D | 1 | 52 | 2466193 | 508.88 | 18144 | 17725 | 4811.5 |
| D | 13 | 105 | 2115142 | 435.92 | 18144 | 17725 | 4811.5 |
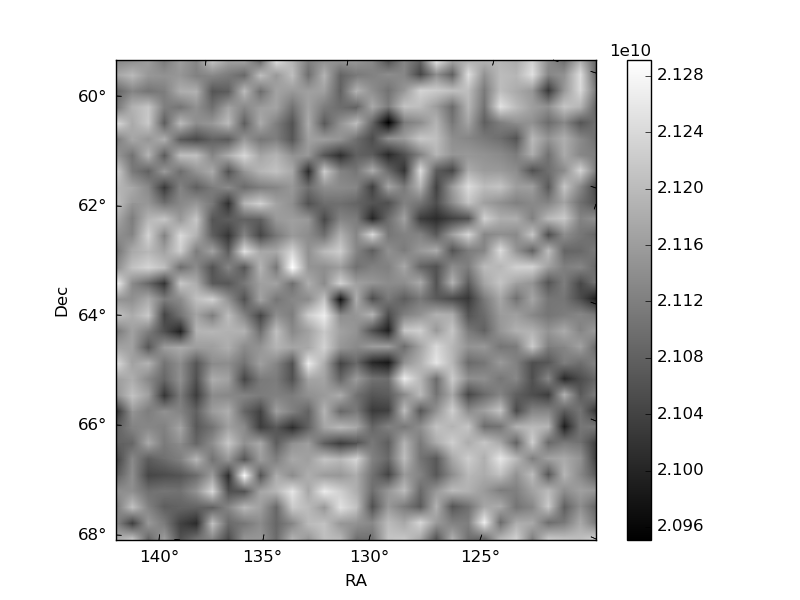
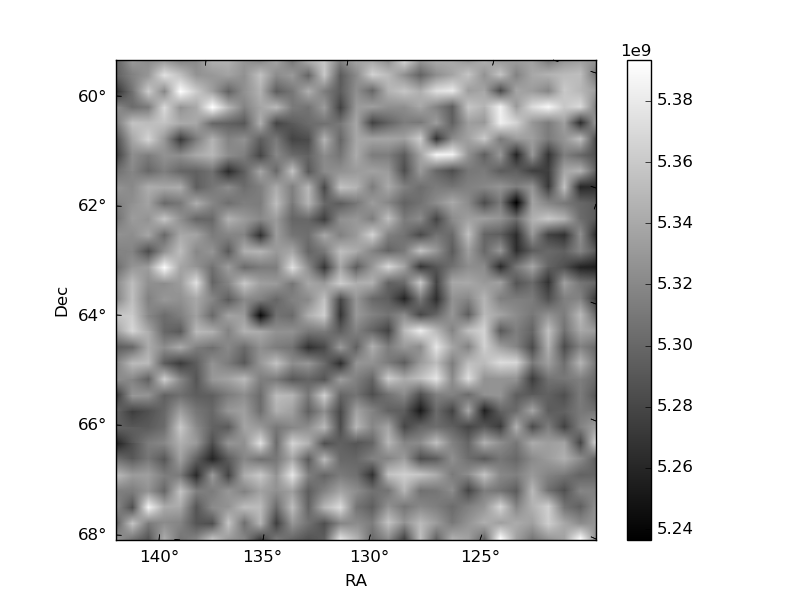
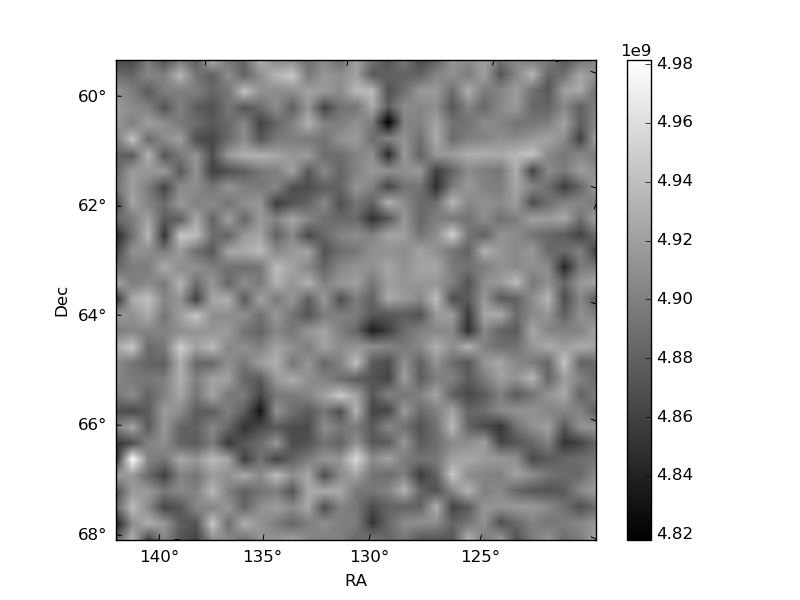
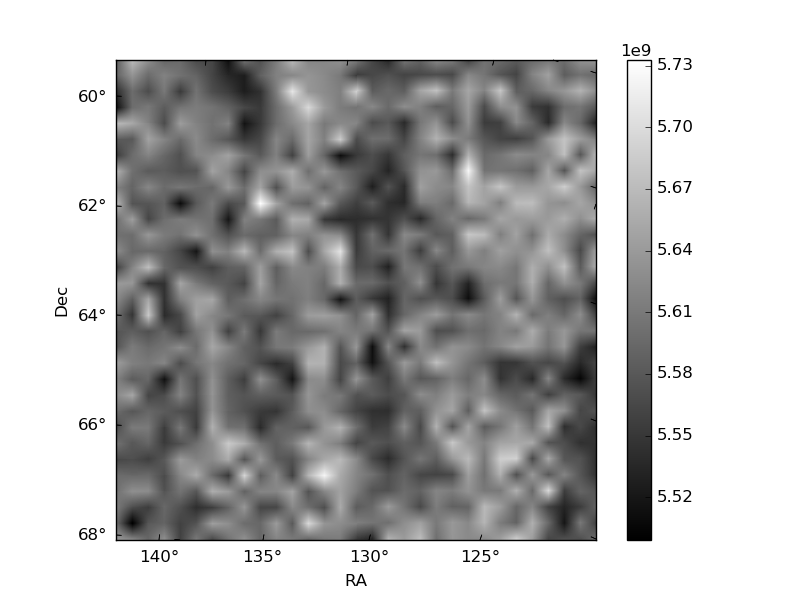
Histogram calculated using DETX and DETY for each event in the final _common_clean file
| Quadrant A |  |
 |
Quadrant B |
|---|---|---|---|
| Quadrant D |  |
 |
Quadrant C |
| Plot type | Count rate plots | Images |
|---|---|---|
| Comparison with Poisson distribution Blue bars denote a histogram of data divided into 1 sec bins. Red curve is a Poisson curve with rate = median count rate of data. |
 |
 |
| Quadrant-wise count rates Data is divided into 100 sec bins |
 |
|
| Module-wise count rates for Quadrant A Data is divided into 100 sec bins |
 |
 |
| Module-wise count rates for Quadrant B Data is divided into 100 sec bins |
 |
 |
| Module-wise count rates for Quadrant C Data is divided into 100 sec bins |
 |
 |
| Module-wise count rates for Quadrant D Data is divided into 100 sec bins |
 |
 |
| Parameter | Plot |
|---|---|
| CZT HV Monitor |  |
| D_VDD | 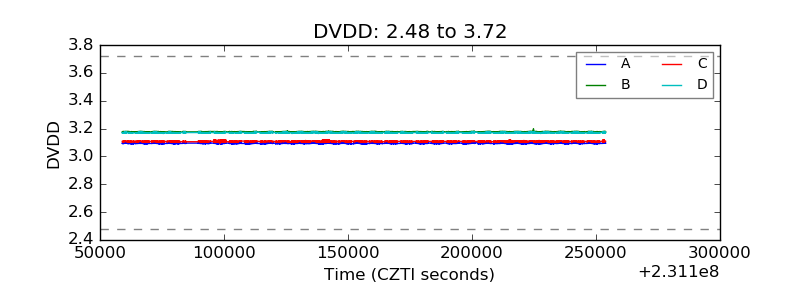 |
| Temperature 1 |  |
| Veto HV Monitor |  |
| Veto LLD |  |
| Alpha Counter |  |
| _CPM_Rate |  |
| CZT Counter | 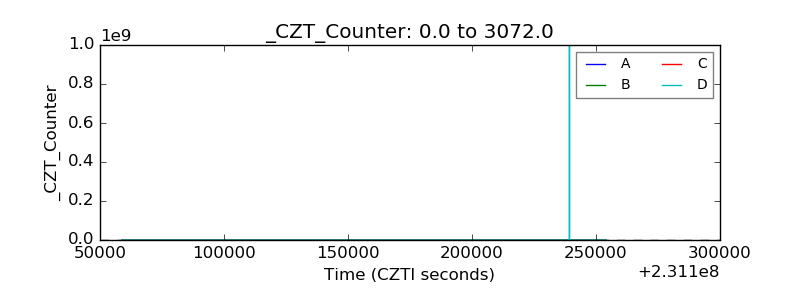 |
| +2.5 Volts monitor | 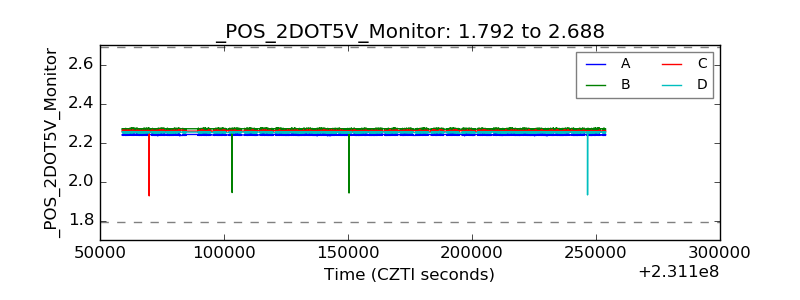 |
| +5 Volts monitor |  |
| _ROLL_ROT | 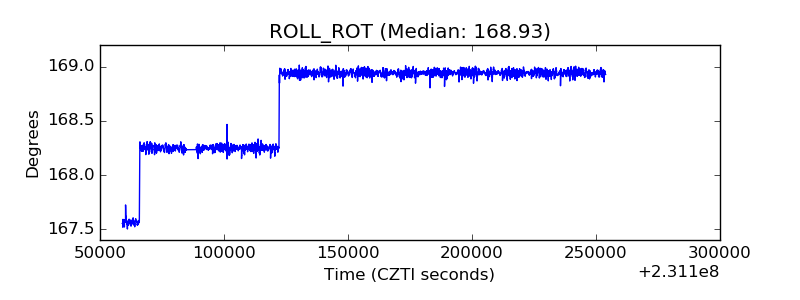 |
| _Roll_DEC |  |
| _Roll_RA | 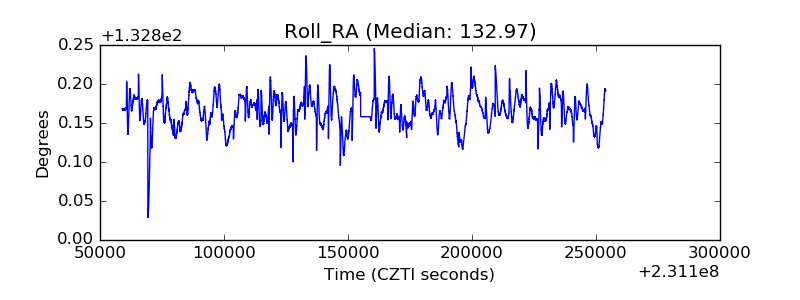 |
| Veto Counter |  |