| Param | Original file | Final file |
|---|---|---|
| Filename | modeM0/AS1C02_033T02_9000001198cztM0_level2.evt | modeM0/AS1C02_033T02_9000001198cztM0_level2_quad_clean.evt |
| Size (bytes) | 1,459,330,560 | 243,354,240 |
| Size | 1.4 GB | 232.1 MB |
| Events in quadrant A | 10,535,943 | 1,467,035 |
| Events in quadrant B | 11,042,656 | 1,469,713 |
| Events in quadrant C | 10,236,007 | 1,439,491 |
| Events in quadrant D | 10,817,586 | 1,403,371 |
| Mode M0 | |||
|---|---|---|---|
| Quadrant | BADHDUFLAG | Total packets | Discarded packets |
| A | 0 | 47612 | 0 |
| B | 0 | 48468 | 0 |
| C | 0 | 47072 | 0 |
| D | 0 | 49018 | 0 |
| Mode M9 | |||
|---|---|---|---|
| Quadrant | BADHDUFLAG | Total packets | Discarded packets |
| A | 0 | 34 | 0 |
| B | 0 | 34 | 0 |
| C | 0 | 34 | 0 |
| D | 0 | 34 | 0 |
| Mode SS | |||
|---|---|---|---|
| Quadrant | BADHDUFLAG | Total packets | Discarded packets |
| A | 0 | 470 | 0 |
| B | 0 | 470 | 0 |
| C | 0 | 470 | 0 |
| D | 0 | 470 | 0 |
| Quadrant | Total seconds | Saturated seconds | Saturation percentage |
|---|---|---|---|
| A | 23114 | 180 | 0.778749% |
| B | 23114 | 192 | 0.830665% |
| C | 23114 | 114 | 0.493208% |
| D | 23113 | 188 | 0.813395% |
Noise dominated data is calculated using 1-second bins in cleaned event files. If a bin has >2000 counts, and if more than 50% of those come from <1% of pixels, then it is considered to be noise-dominated and hence unusable.
| Quadrant | # 1 sec bins | Bins with >0 counts | Bins with >2000 counts | High rate bins dominated by noise | Noise dominated (total time) | Noise dominated (detector-on time) | Marked lightcurve |
|---|---|---|---|---|---|---|---|
| A | 26514 | 23117 | 15 | 15 | 0.06% | 0.06% |  |
| B | 26514 | 23116 | 15 | 15 | 0.06% | 0.06% | 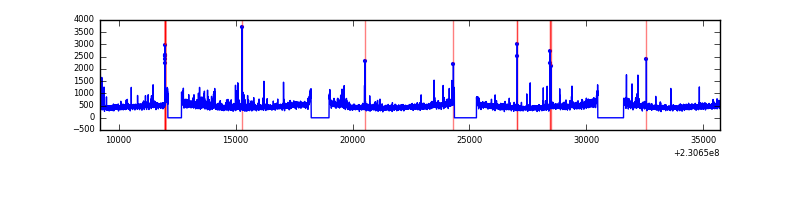 |
| C | 26514 | 23117 | 0 | 0 | 0.00% | 0.00% |  |
| D | 26514 | 23118 | 42 | 42 | 0.16% | 0.18% |  |
Top three noisy pixels from each quadrant. If the there are fewer than three noisy pixels in the level2.evt file, extra rows are filled as -1
| Pixel properties | Quadrant properties | ||||||
|---|---|---|---|---|---|---|---|
| Quadrant | DetID | PixID | Counts | Sigma | Mean | Median | Sigma |
| A | 5 | 16 | 133458 | 237.57 | 2697 | 2639 | 550.6 |
| A | 13 | 251 | 32938 | 55.02 | 2697 | 2639 | 550.6 |
| A | 0 | 226 | 24900 | 40.43 | 2697 | 2639 | 550.6 |
| B | 0 | 214 | 199373 | 378.68 | 2709 | 2646 | 519.5 |
| B | 4 | 81 | 146116 | 276.16 | 2709 | 2646 | 519.5 |
| B | 12 | 111 | 57121 | 104.86 | 2709 | 2646 | 519.5 |
| C | 8 | 128 | 22925 | 33.52 | 2611 | 2627 | 605.6 |
| C | 13 | 61 | 20404 | 29.35 | 2611 | 2627 | 605.6 |
| C | 8 | 222 | 13282 | 17.59 | 2611 | 2627 | 605.6 |
| D | 1 | 52 | 625473 | 932.21 | 2592 | 2526 | 668.3 |
| D | 13 | 105 | 128897 | 189.11 | 2592 | 2526 | 668.3 |
| D | 2 | 234 | 78542 | 113.75 | 2592 | 2526 | 668.3 |
Histogram calculated using DETX and DETY for each event in the final _common_clean file
| Quadrant A | 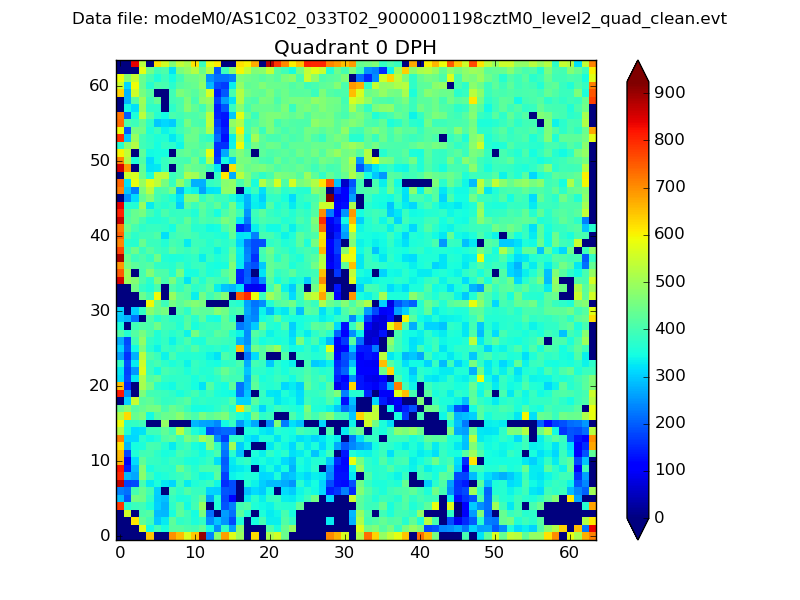 |
 |
Quadrant B |
|---|---|---|---|
| Quadrant D |  |
 |
Quadrant C |
| Plot type | Count rate plots | Images |
|---|---|---|
| Comparison with Poisson distribution Blue bars denote a histogram of data divided into 1 sec bins. Red curve is a Poisson curve with rate = median count rate of data. |
 |
 |
| Quadrant-wise count rates Data is divided into 100 sec bins |
 |
|
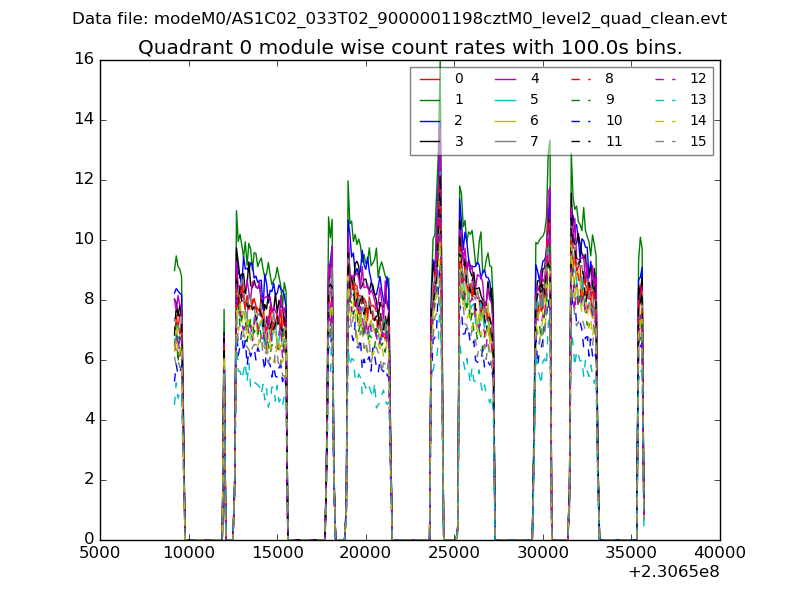
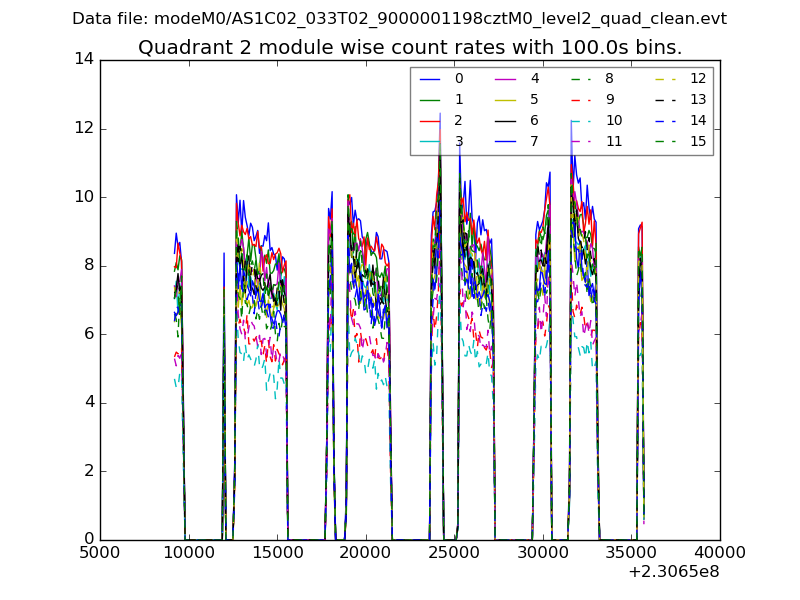
| Module-wise count rates for Quadrant A Data is divided into 100 sec bins |
 |
 |
| Module-wise count rates for Quadrant B Data is divided into 100 sec bins |
 |
 |
| Module-wise count rates for Quadrant C Data is divided into 100 sec bins |
 |
 |
| Module-wise count rates for Quadrant D Data is divided into 100 sec bins |
 |
 |
| Parameter | Plot |
|---|---|
| CZT HV Monitor | 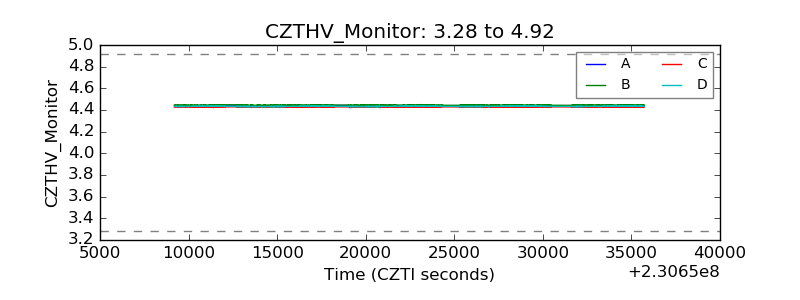 |
| D_VDD |  |
| Temperature 1 | 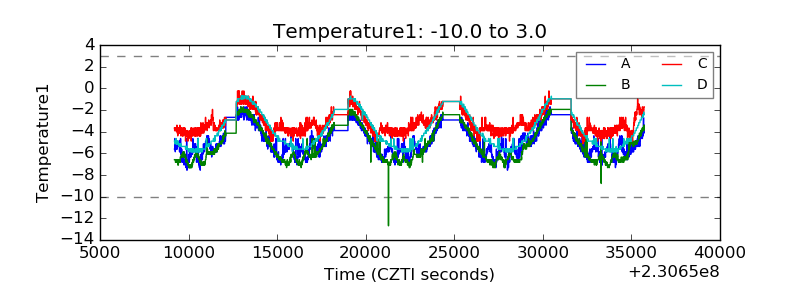 |
| Veto HV Monitor | 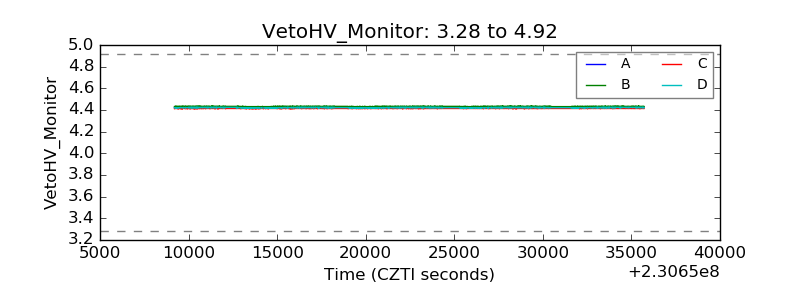 |
| Veto LLD |  |
| Alpha Counter |  |
| _CPM_Rate |  |
| CZT Counter | 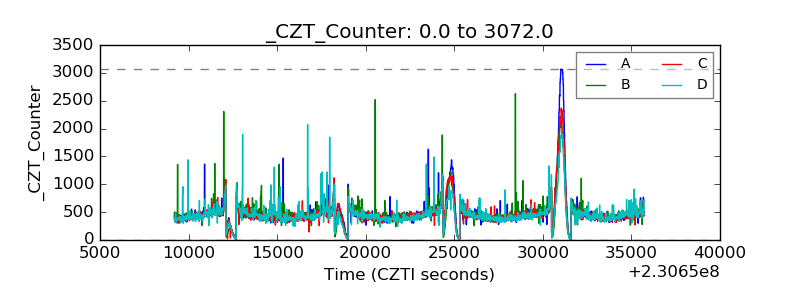 |
| +2.5 Volts monitor | 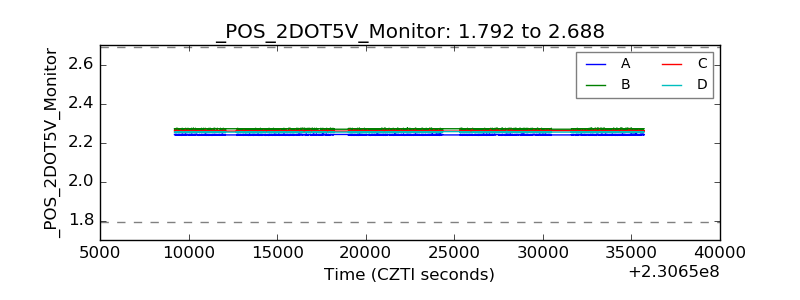 |
| +5 Volts monitor | 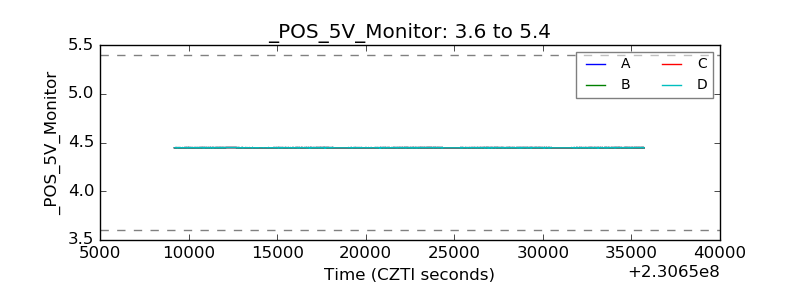 |
| _ROLL_ROT |  |
| _Roll_DEC |  |
| _Roll_RA |  |
| Veto Counter | 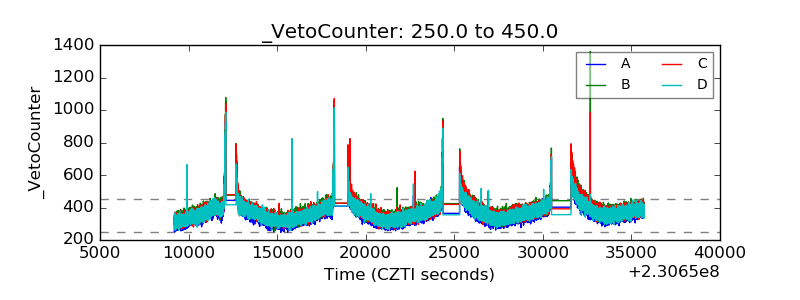 |