| Param | Original file | Final file |
|---|---|---|
| Filename | modeM0/AS1G07_007T01_9000001196cztM0_level2.evt | modeM0/AS1G07_007T01_9000001196cztM0_level2_quad_clean.evt |
| Size (bytes) | 3,853,270,080 | 607,438,080 |
| Size | 3.6 GB | 579.3 MB |
| Events in quadrant A | 33,572,391 | 3,714,170 |
| Events in quadrant B | 27,116,521 | 3,823,337 |
| Events in quadrant C | 23,524,191 | 3,750,080 |
| Events in quadrant D | 29,042,200 | 3,608,728 |
| Mode M0 | |||
|---|---|---|---|
| Quadrant | BADHDUFLAG | Total packets | Discarded packets |
| A | 0 | 133830 | 0 |
| B | 0 | 112666 | 0 |
| C | 0 | 105293 | 0 |
| D | 0 | 121903 | 0 |
| Mode SS | |||
|---|---|---|---|
| Quadrant | BADHDUFLAG | Total packets | Discarded packets |
| A | 0 | 1038 | 0 |
| B | 0 | 1038 | 0 |
| C | 0 | 1038 | 0 |
| D | 0 | 1038 | 0 |
| Mode M9 | |||
|---|---|---|---|
| Quadrant | BADHDUFLAG | Total packets | Discarded packets |
| A | 0 | 66 | 0 |
| B | 0 | 66 | 0 |
| C | 0 | 66 | 0 |
| D | 0 | 66 | 0 |
| Quadrant | Total seconds | Saturated seconds | Saturation percentage |
|---|---|---|---|
| A | 51022 | 3749 | 7.347811% |
| B | 51022 | 1293 | 2.534201% |
| C | 51022 | 602 | 1.179883% |
| D | 51021 | 1644 | 3.222203% |
Noise dominated data is calculated using 1-second bins in cleaned event files. If a bin has >2000 counts, and if more than 50% of those come from <1% of pixels, then it is considered to be noise-dominated and hence unusable.
| Quadrant | # 1 sec bins | Bins with >0 counts | Bins with >2000 counts | High rate bins dominated by noise | Noise dominated (total time) | Noise dominated (detector-on time) | Marked lightcurve |
|---|---|---|---|---|---|---|---|
| A | 57633 | 51028 | 2200 | 2200 | 3.82% | 4.31% |  |
| B | 57633 | 51027 | 176 | 176 | 0.31% | 0.34% |  |
| C | 57633 | 51032 | 1 | 1 | 0.00% | 0.00% | 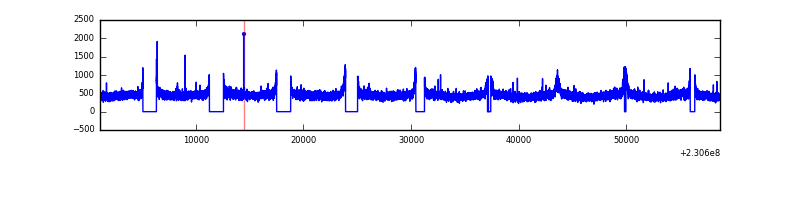 |
| D | 57633 | 51030 | 627 | 627 | 1.09% | 1.23% |  |
Top three noisy pixels from each quadrant. If the there are fewer than three noisy pixels in the level2.evt file, extra rows are filled as -1
| Pixel properties | Quadrant properties | ||||||
|---|---|---|---|---|---|---|---|
| Quadrant | DetID | PixID | Counts | Sigma | Mean | Median | Sigma |
| A | 5 | 16 | 9161253 | 7394.76 | 6108 | 5985 | 1238.1 |
| A | 15 | 236 | 685081 | 548.51 | 6108 | 5985 | 1238.1 |
| A | 13 | 251 | 69898 | 51.62 | 6108 | 5985 | 1238.1 |
| B | 11 | 51 | 720275 | 605.67 | 6235 | 6090 | 1179.2 |
| B | 0 | 214 | 642161 | 539.42 | 6235 | 6090 | 1179.2 |
| B | 5 | 255 | 604378 | 507.38 | 6235 | 6090 | 1179.2 |
| C | 13 | 61 | 46241 | 28.7 | 6024 | 6053 | 1400.2 |
| C | 8 | 222 | 36416 | 21.68 | 6024 | 6053 | 1400.2 |
| C | 3 | 202 | 15040 | 6.42 | 6024 | 6053 | 1400.2 |
| D | 1 | 52 | 2957405 | 1905.78 | 5971 | 5829 | 1548.7 |
| D | 12 | 233 | 1233049 | 792.4 | 5971 | 5829 | 1548.7 |
| D | 12 | 221 | 979959 | 628.98 | 5971 | 5829 | 1548.7 |
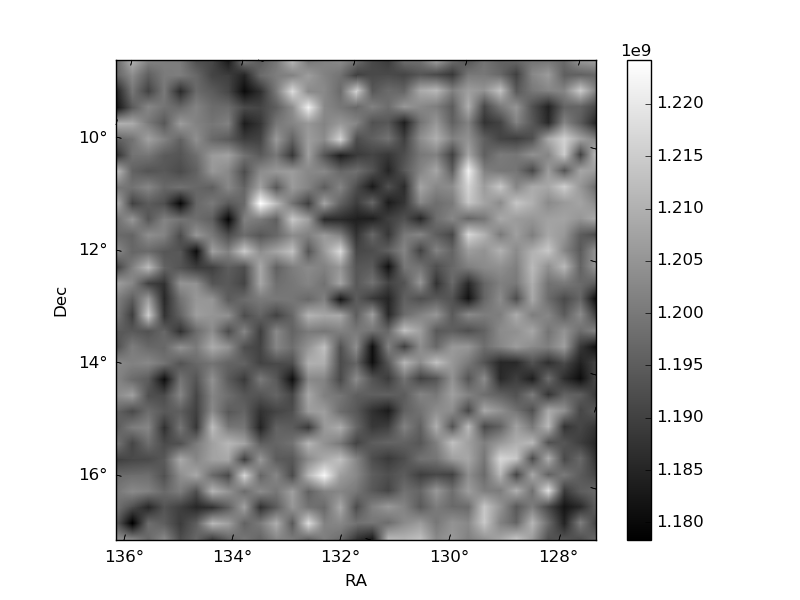
Histogram calculated using DETX and DETY for each event in the final _common_clean file
| Quadrant A |  |
 |
Quadrant B |
|---|---|---|---|
| Quadrant D |  |
 |
Quadrant C |
| Plot type | Count rate plots | Images |
|---|---|---|
| Comparison with Poisson distribution Blue bars denote a histogram of data divided into 1 sec bins. Red curve is a Poisson curve with rate = median count rate of data. |
 |
 |
| Quadrant-wise count rates Data is divided into 100 sec bins |
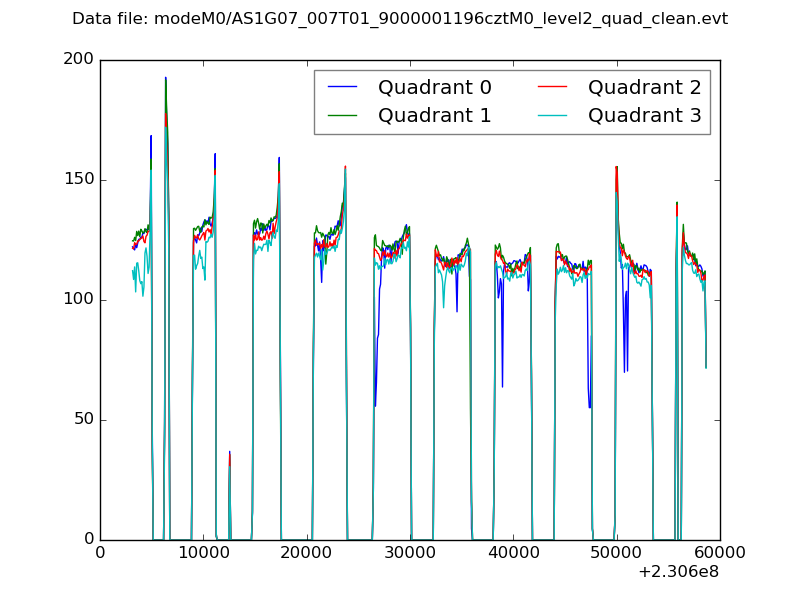 |
|
| Module-wise count rates for Quadrant A Data is divided into 100 sec bins |
 |
 |
| Module-wise count rates for Quadrant B Data is divided into 100 sec bins |
 |
 |
| Module-wise count rates for Quadrant C Data is divided into 100 sec bins |
 |
 |
| Module-wise count rates for Quadrant D Data is divided into 100 sec bins |
 |
 |
| Parameter | Plot |
|---|---|
| CZT HV Monitor | 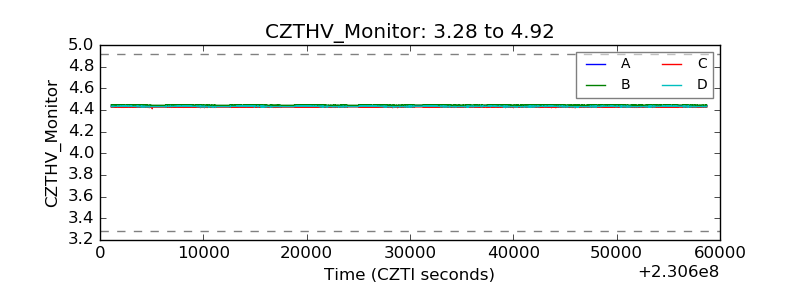 |
| D_VDD |  |
| Temperature 1 |  |
| Veto HV Monitor |  |
| Veto LLD |  |
| Alpha Counter |  |
| _CPM_Rate |  |
| CZT Counter |  |
| +2.5 Volts monitor |  |
| +5 Volts monitor | 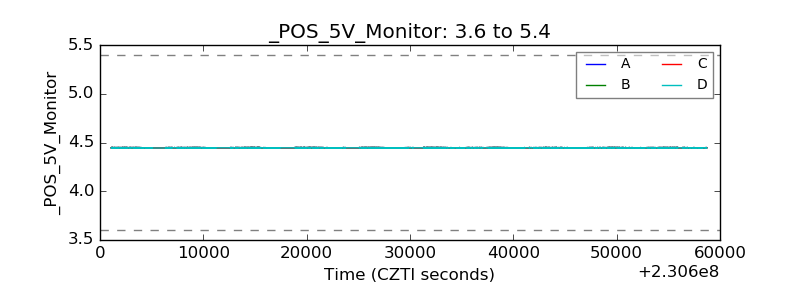 |
| _ROLL_ROT | 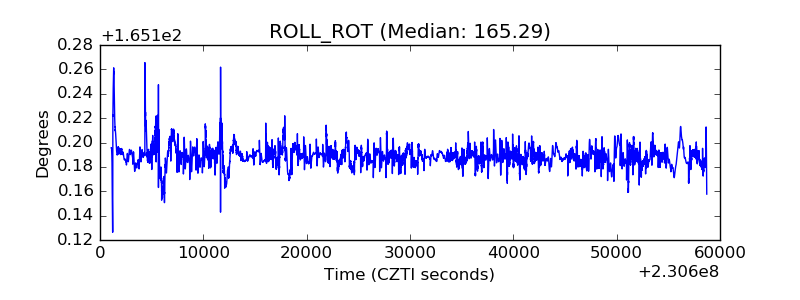 |
| _Roll_DEC | 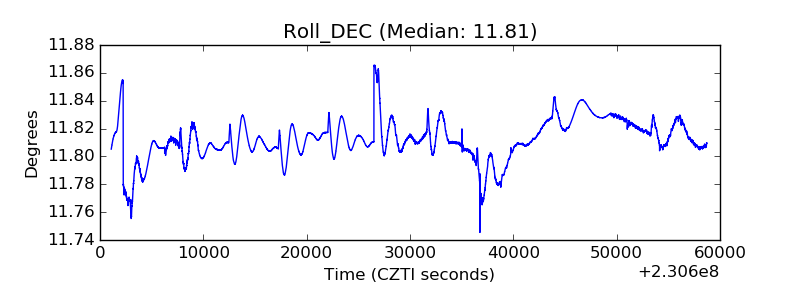 |
| _Roll_RA | 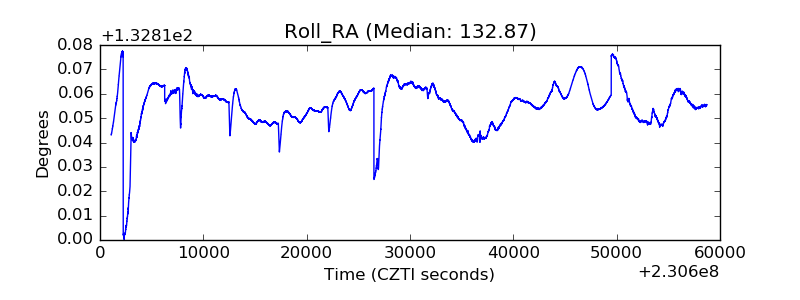 |
| Veto Counter |  |