| Param | Original file | Final file |
|---|---|---|
| Filename | modeM0/AS1A03_030T01_9000001194cztM0_level2.evt | modeM0/AS1A03_030T01_9000001194cztM0_level2_quad_clean.evt |
| Size (bytes) | 2,703,286,080 | 388,676,160 |
| Size | 2.5 GB | 370.7 MB |
| Events in quadrant A | 16,231,838 | 2,419,933 |
| Events in quadrant B | 16,848,150 | 2,421,745 |
| Events in quadrant C | 15,902,804 | 2,387,463 |
| Events in quadrant D | 30,503,537 | 2,116,684 |
| Mode M0 | |||
|---|---|---|---|
| Quadrant | BADHDUFLAG | Total packets | Discarded packets |
| A | 0 | 72776 | 0 |
| B | 0 | 73779 | 0 |
| C | 0 | 72422 | 0 |
| D | 0 | 115510 | 0 |
| Mode M9 | |||
|---|---|---|---|
| Quadrant | BADHDUFLAG | Total packets | Discarded packets |
| A | 0 | 47 | 0 |
| B | 0 | 47 | 0 |
| C | 0 | 47 | 0 |
| D | 0 | 47 | 0 |
| Mode SS | |||
|---|---|---|---|
| Quadrant | BADHDUFLAG | Total packets | Discarded packets |
| A | 0 | 714 | 0 |
| B | 0 | 714 | 0 |
| C | 0 | 714 | 0 |
| D | 0 | 714 | 0 |
| Quadrant | Total seconds | Saturated seconds | Saturation percentage |
|---|---|---|---|
| A | 35313 | 588 | 1.665109% |
| B | 35315 | 660 | 1.868894% |
| C | 35313 | 417 | 1.180868% |
| D | 35312 | 5169 | 14.638083% |
Noise dominated data is calculated using 1-second bins in cleaned event files. If a bin has >2000 counts, and if more than 50% of those come from <1% of pixels, then it is considered to be noise-dominated and hence unusable.
| Quadrant | # 1 sec bins | Bins with >0 counts | Bins with >2000 counts | High rate bins dominated by noise | Noise dominated (total time) | Noise dominated (detector-on time) | Marked lightcurve |
|---|---|---|---|---|---|---|---|
| A | 39781 | 35320 | 2 | 2 | 0.01% | 0.01% |  |
| B | 39781 | 35318 | 33 | 33 | 0.08% | 0.09% |  |
| C | 39781 | 35320 | 3 | 3 | 0.01% | 0.01% |  |
| D | 39781 | 35317 | 4284 | 4284 | 10.77% | 12.13% | 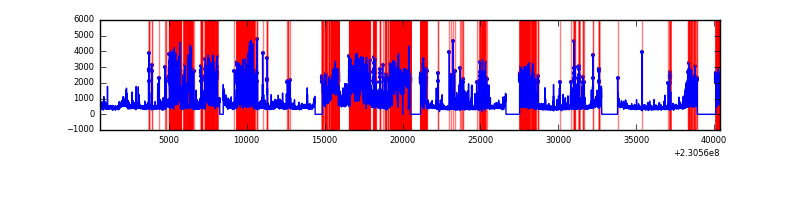 |
Top three noisy pixels from each quadrant. If the there are fewer than three noisy pixels in the level2.evt file, extra rows are filled as -1
| Pixel properties | Quadrant properties | ||||||
|---|---|---|---|---|---|---|---|
| Quadrant | DetID | PixID | Counts | Sigma | Mean | Median | Sigma |
| A | 4 | 2 | 80410 | 89.81 | 4173 | 4085 | 849.9 |
| A | 13 | 251 | 79900 | 89.21 | 4173 | 4085 | 849.9 |
| A | 0 | 226 | 38550 | 40.55 | 4173 | 4085 | 849.9 |
| B | 0 | 214 | 206642 | 252.65 | 4177 | 4075 | 801.8 |
| B | 11 | 51 | 138561 | 167.73 | 4177 | 4075 | 801.8 |
| B | 12 | 111 | 91726 | 109.32 | 4177 | 4075 | 801.8 |
| C | 13 | 61 | 30861 | 28.42 | 4057 | 4064 | 942.8 |
| C | 9 | 54 | 28336 | 25.74 | 4057 | 4064 | 942.8 |
| C | 8 | 128 | 23284 | 20.39 | 4057 | 4064 | 942.8 |
| D | 13 | 105 | 8173341 | 8957.84 | 3737 | 3639 | 912.0 |
| D | 12 | 221 | 4131614 | 4526.21 | 3737 | 3639 | 912.0 |
| D | 1 | 52 | 3350563 | 3669.81 | 3737 | 3639 | 912.0 |
Histogram calculated using DETX and DETY for each event in the final _common_clean file
| Quadrant A |  |
 |
Quadrant B |
|---|---|---|---|
| Quadrant D |  |
 |
Quadrant C |
| Plot type | Count rate plots | Images |
|---|---|---|
| Comparison with Poisson distribution Blue bars denote a histogram of data divided into 1 sec bins. Red curve is a Poisson curve with rate = median count rate of data. |
 |
 |
| Quadrant-wise count rates Data is divided into 100 sec bins |
 |
|
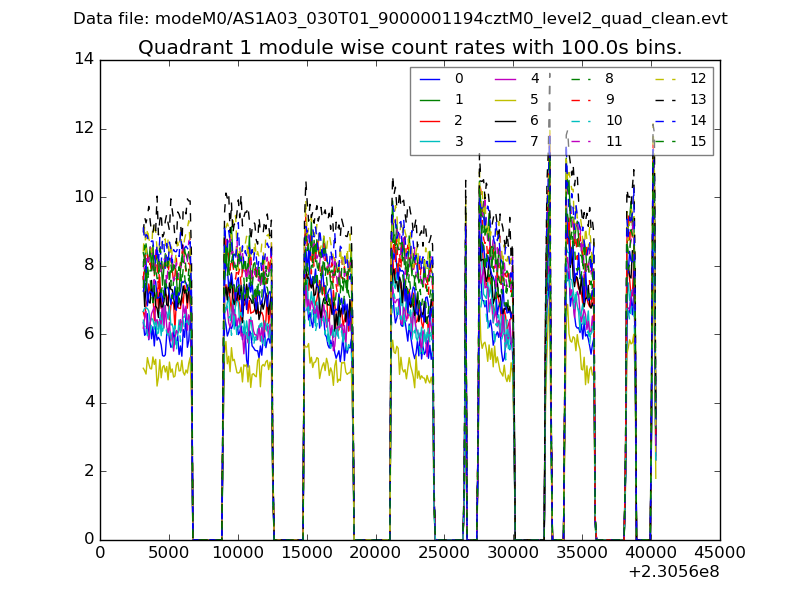
| Module-wise count rates for Quadrant A Data is divided into 100 sec bins |
 |
 |
| Module-wise count rates for Quadrant B Data is divided into 100 sec bins |
 |
 |
| Module-wise count rates for Quadrant C Data is divided into 100 sec bins |
 |
 |
| Module-wise count rates for Quadrant D Data is divided into 100 sec bins |
 |
 |
| Parameter | Plot |
|---|---|
| CZT HV Monitor |  |
| D_VDD |  |
| Temperature 1 |  |
| Veto HV Monitor | 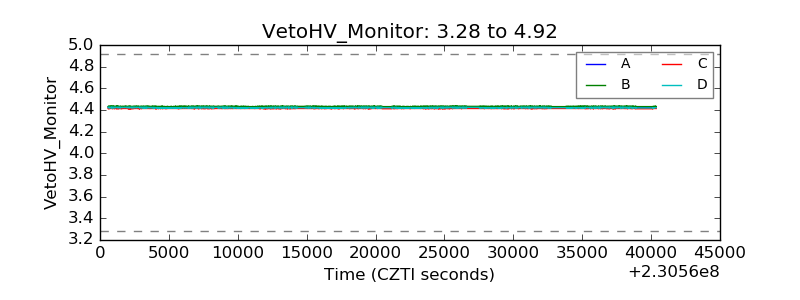 |
| Veto LLD |  |
| Alpha Counter |  |
| _CPM_Rate |  |
| CZT Counter |  |
| +2.5 Volts monitor |  |
| +5 Volts monitor |  |
| _ROLL_ROT |  |
| _Roll_DEC |  |
| _Roll_RA |  |
| Veto Counter |  |