| Param | Original file | Final file |
|---|---|---|
| Filename | modeM0/AS1A03_106T01_9000001190cztM0_level2.evt | modeM0/AS1A03_106T01_9000001190cztM0_level2_quad_clean.evt |
| Size (bytes) | 1,463,664,960 | 332,337,600 |
| Size | 1.4 GB | 316.9 MB |
| Events in quadrant A | 10,506,453 | 2,142,518 |
| Events in quadrant B | 11,031,002 | 2,196,626 |
| Events in quadrant C | 10,201,756 | 2,171,211 |
| Events in quadrant D | 11,130,540 | 2,071,973 |
| Mode M0 | |||
|---|---|---|---|
| Quadrant | BADHDUFLAG | Total packets | Discarded packets |
| A | 0 | 45174 | 0 |
| B | 0 | 46223 | 0 |
| C | 0 | 44583 | 0 |
| D | 0 | 47731 | 0 |
| Mode M9 | |||
|---|---|---|---|
| Quadrant | BADHDUFLAG | Total packets | Discarded packets |
| A | 0 | 59 | 0 |
| B | 0 | 59 | 0 |
| C | 0 | 59 | 0 |
| D | 0 | 59 | 0 |
| Mode SS | |||
|---|---|---|---|
| Quadrant | BADHDUFLAG | Total packets | Discarded packets |
| A | 0 | 444 | 0 |
| B | 0 | 444 | 0 |
| C | 0 | 444 | 0 |
| D | 0 | 444 | 0 |
| Quadrant | Total seconds | Saturated seconds | Saturation percentage |
|---|---|---|---|
| A | 21553 | 161 | 0.746996% |
| B | 21556 | 200 | 0.927816% |
| C | 21556 | 132 | 0.612359% |
| D | 21554 | 160 | 0.742322% |
Noise dominated data is calculated using 1-second bins in cleaned event files. If a bin has >2000 counts, and if more than 50% of those come from <1% of pixels, then it is considered to be noise-dominated and hence unusable.
| Quadrant | # 1 sec bins | Bins with >0 counts | Bins with >2000 counts | High rate bins dominated by noise | Noise dominated (total time) | Noise dominated (detector-on time) | Marked lightcurve |
|---|---|---|---|---|---|---|---|
| A | 27521 | 21561 | 17 | 17 | 0.06% | 0.08% |  |
| B | 27521 | 21561 | 38 | 38 | 0.14% | 0.18% |  |
| C | 27521 | 21561 | 36 | 36 | 0.13% | 0.17% |  |
| D | 27521 | 21560 | 67 | 67 | 0.24% | 0.31% |  |
Top three noisy pixels from each quadrant. If the there are fewer than three noisy pixels in the level2.evt file, extra rows are filled as -1
| Pixel properties | Quadrant properties | ||||||
|---|---|---|---|---|---|---|---|
| Quadrant | DetID | PixID | Counts | Sigma | Mean | Median | Sigma |
| A | 15 | 236 | 245072 | 469.25 | 2613 | 2566 | 516.8 |
| A | 14 | 111 | 54531 | 100.55 | 2613 | 2566 | 516.8 |
| A | 15 | 223 | 54147 | 99.81 | 2613 | 2566 | 516.8 |
| B | 0 | 214 | 354174 | 729.18 | 2634 | 2570 | 482.2 |
| B | 4 | 81 | 175235 | 358.08 | 2634 | 2570 | 482.2 |
| B | 10 | 16 | 135890 | 276.49 | 2634 | 2570 | 482.2 |
| C | 12 | 4 | 156762 | 266.28 | 2561 | 2575 | 579.0 |
| C | 13 | 255 | 25756 | 40.03 | 2561 | 2575 | 579.0 |
| C | 13 | 61 | 23588 | 36.29 | 2561 | 2575 | 579.0 |
| D | 6 | 225 | 505460 | 824.84 | 2555 | 2482 | 609.8 |
| D | 7 | 71 | 431457 | 703.48 | 2555 | 2482 | 609.8 |
| D | 12 | 233 | 203140 | 329.06 | 2555 | 2482 | 609.8 |
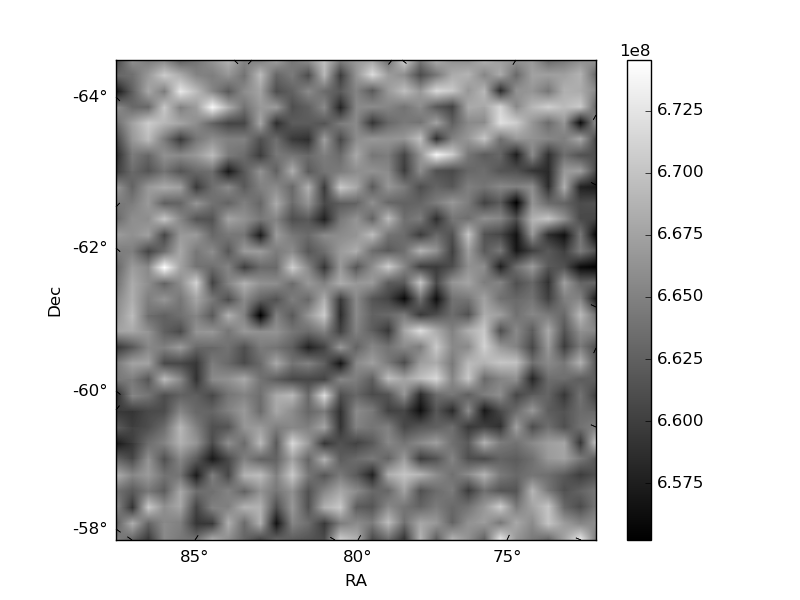
Histogram calculated using DETX and DETY for each event in the final _common_clean file
| Quadrant A |  |
 |
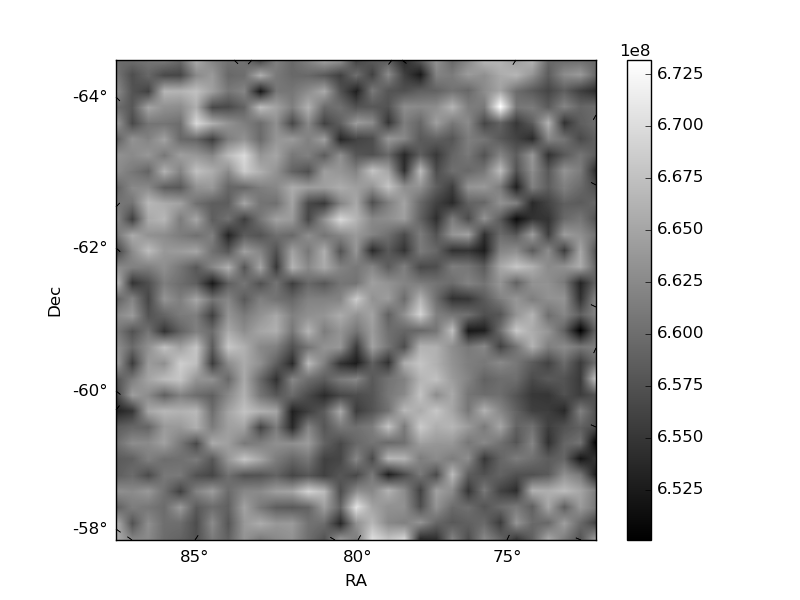
Quadrant B |
|---|---|---|---|
| Quadrant D |  |
 |
Quadrant C |
| Plot type | Count rate plots | Images |
|---|---|---|
| Comparison with Poisson distribution Blue bars denote a histogram of data divided into 1 sec bins. Red curve is a Poisson curve with rate = median count rate of data. |
 |
 |
| Quadrant-wise count rates Data is divided into 100 sec bins |
 |
|
| Module-wise count rates for Quadrant A Data is divided into 100 sec bins |
 |
 |
| Module-wise count rates for Quadrant B Data is divided into 100 sec bins |
 |
 |
| Module-wise count rates for Quadrant C Data is divided into 100 sec bins |
 |
 |
| Module-wise count rates for Quadrant D Data is divided into 100 sec bins |
 |
 |
| Parameter | Plot |
|---|---|
| CZT HV Monitor |  |
| D_VDD |  |
| Temperature 1 |  |
| Veto HV Monitor |  |
| Veto LLD |  |
| Alpha Counter |  |
| _CPM_Rate |  |
| CZT Counter |  |
| +2.5 Volts monitor |  |
| +5 Volts monitor |  |
| _ROLL_ROT |  |
| _Roll_DEC | 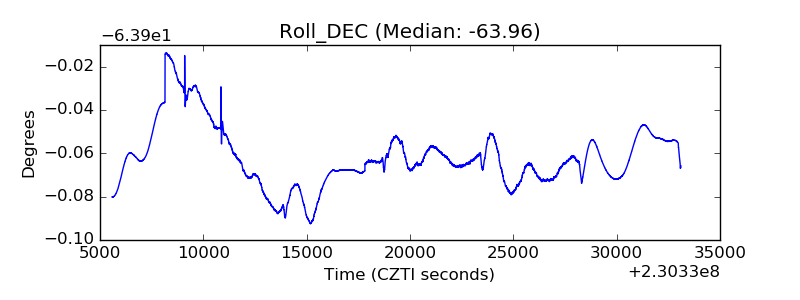 |
| _Roll_RA | 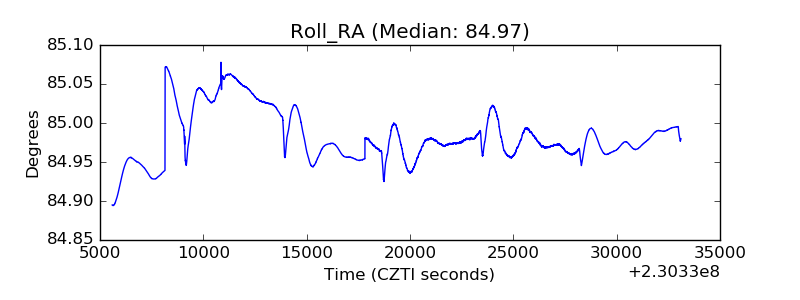 |
| Veto Counter | 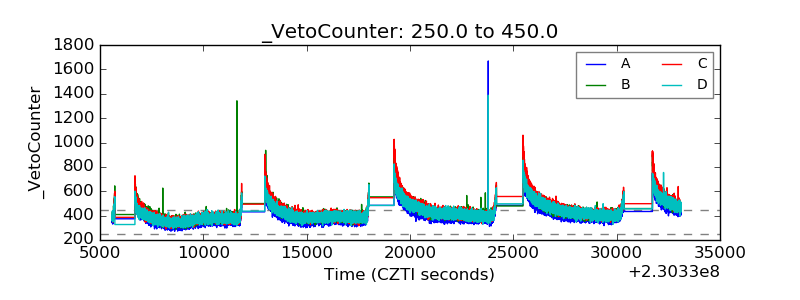 |