| Param | Original file | Final file |
|---|---|---|
| Filename | modeM0/AS1G07_053T01_9000001186cztM0_level2.evt | modeM0/AS1G07_053T01_9000001186cztM0_level2_quad_clean.evt |
| Size (bytes) | 1,922,817,600 | 329,132,160 |
| Size | 1.8 GB | 313.9 MB |
| Events in quadrant A | 13,374,828 | 2,044,640 |
| Events in quadrant B | 14,610,151 | 2,087,414 |
| Events in quadrant C | 12,885,215 | 2,057,973 |
| Events in quadrant D | 15,552,683 | 1,935,228 |
| Mode M0 | |||
|---|---|---|---|
| Quadrant | BADHDUFLAG | Total packets | Discarded packets |
| A | 0 | 56197 | 0 |
| B | 0 | 59687 | 0 |
| C | 0 | 55155 | 0 |
| D | 0 | 63812 | 0 |
| Mode SS | |||
|---|---|---|---|
| Quadrant | BADHDUFLAG | Total packets | Discarded packets |
| A | 0 | 548 | 0 |
| B | 0 | 546 | 0 |
| C | 0 | 546 | 0 |
| D | 0 | 546 | 0 |
| Mode M9 | |||
|---|---|---|---|
| Quadrant | BADHDUFLAG | Total packets | Discarded packets |
| A | 0 | 60 | 0 |
| B | 0 | 60 | 0 |
| C | 0 | 60 | 0 |
| D | 0 | 60 | 0 |
| Quadrant | Total seconds | Saturated seconds | Saturation percentage |
|---|---|---|---|
| A | 26808 | 286 | 1.066846% |
| B | 26811 | 489 | 1.823878% |
| C | 26807 | 133 | 0.496139% |
| D | 26809 | 566 | 2.111231% |
Noise dominated data is calculated using 1-second bins in cleaned event files. If a bin has >2000 counts, and if more than 50% of those come from <1% of pixels, then it is considered to be noise-dominated and hence unusable.
| Quadrant | # 1 sec bins | Bins with >0 counts | Bins with >2000 counts | High rate bins dominated by noise | Noise dominated (total time) | Noise dominated (detector-on time) | Marked lightcurve |
|---|---|---|---|---|---|---|---|
| A | 33013 | 26862 | 46 | 46 | 0.14% | 0.17% |  |
| B | 33013 | 26862 | 234 | 234 | 0.71% | 0.87% | 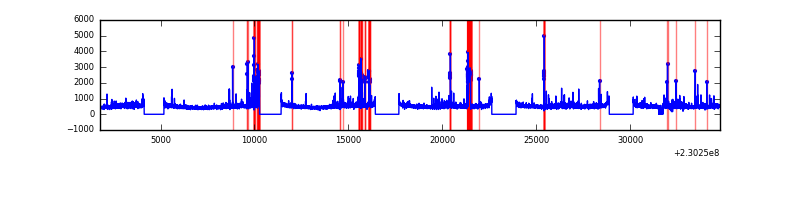 |
| C | 33013 | 26859 | 0 | 0 | 0.00% | 0.00% |  |
| D | 33013 | 26864 | 415 | 415 | 1.26% | 1.54% |  |
Top three noisy pixels from each quadrant. If the there are fewer than three noisy pixels in the level2.evt file, extra rows are filled as -1
| Pixel properties | Quadrant properties | ||||||
|---|---|---|---|---|---|---|---|
| Quadrant | DetID | PixID | Counts | Sigma | Mean | Median | Sigma |
| A | 14 | 111 | 323846 | 475.26 | 3355 | 3293 | 674.5 |
| A | 5 | 16 | 45224 | 62.17 | 3355 | 3293 | 674.5 |
| A | 13 | 251 | 38916 | 52.82 | 3355 | 3293 | 674.5 |
| B | 10 | 16 | 831700 | 1331.79 | 3347 | 3272 | 622.0 |
| B | 0 | 214 | 498886 | 796.75 | 3347 | 3272 | 622.0 |
| B | 12 | 111 | 65167 | 99.5 | 3347 | 3272 | 622.0 |
| C | 13 | 61 | 24700 | 28.26 | 3297 | 3320 | 756.6 |
| C | 14 | 67 | 20716 | 22.99 | 3297 | 3320 | 756.6 |
| C | 9 | 160 | 9930 | 8.74 | 3297 | 3320 | 756.6 |
| D | 1 | 52 | 1311543 | 1505.29 | 3257 | 3181 | 869.2 |
| D | 12 | 221 | 1137734 | 1305.32 | 3257 | 3181 | 869.2 |
| D | 12 | 227 | 195214 | 220.94 | 3257 | 3181 | 869.2 |
Histogram calculated using DETX and DETY for each event in the final _common_clean file
| Quadrant A |  |
 |
Quadrant B |
|---|---|---|---|
| Quadrant D |  |
 |
Quadrant C |
| Plot type | Count rate plots | Images |
|---|---|---|
| Comparison with Poisson distribution Blue bars denote a histogram of data divided into 1 sec bins. Red curve is a Poisson curve with rate = median count rate of data. |
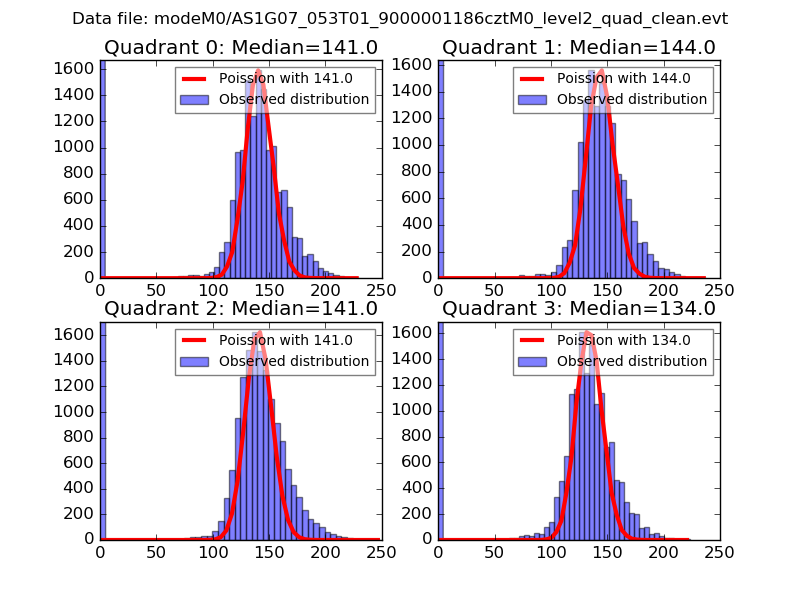 |
 |
| Quadrant-wise count rates Data is divided into 100 sec bins |
 |
|
| Module-wise count rates for Quadrant A Data is divided into 100 sec bins |
 |
 |
| Module-wise count rates for Quadrant B Data is divided into 100 sec bins |
 |
 |
| Module-wise count rates for Quadrant C Data is divided into 100 sec bins |
 |
 |
| Module-wise count rates for Quadrant D Data is divided into 100 sec bins |
 |
 |
| Parameter | Plot |
|---|---|
| CZT HV Monitor |  |
| D_VDD |  |
| Temperature 1 | 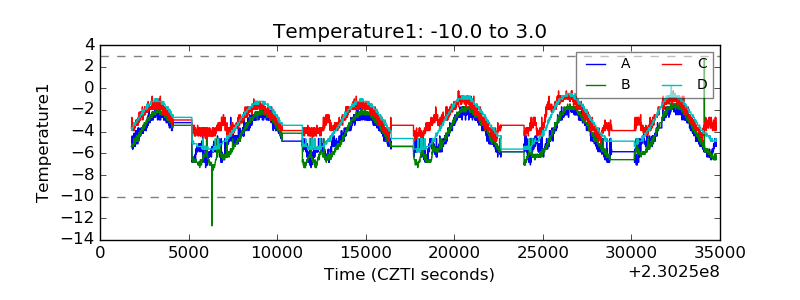 |
| Veto HV Monitor | 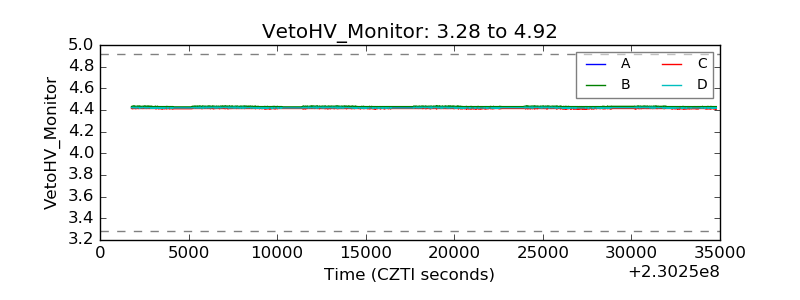 |
| Veto LLD |  |
| Alpha Counter |  |
| _CPM_Rate |  |
| CZT Counter | 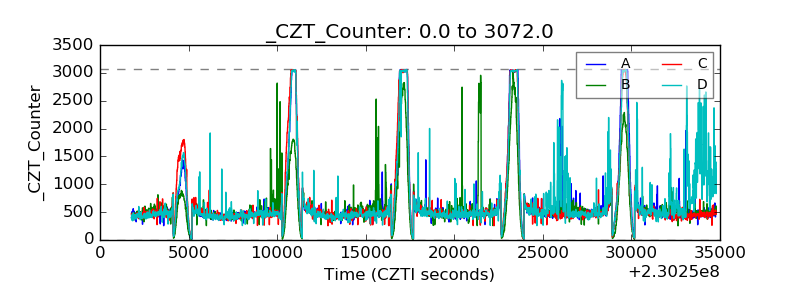 |
| +2.5 Volts monitor | 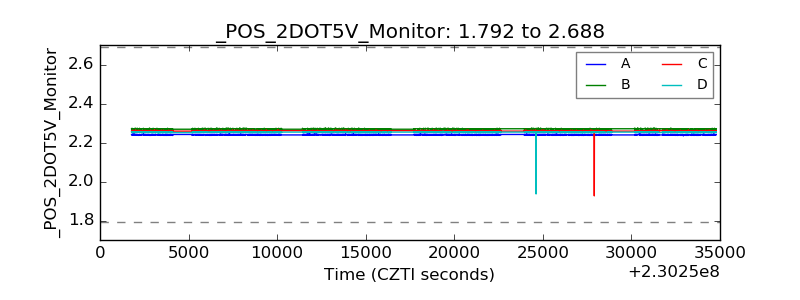 |
| +5 Volts monitor |  |
| _ROLL_ROT |  |
| _Roll_DEC |  |
| _Roll_RA |  |
| Veto Counter | 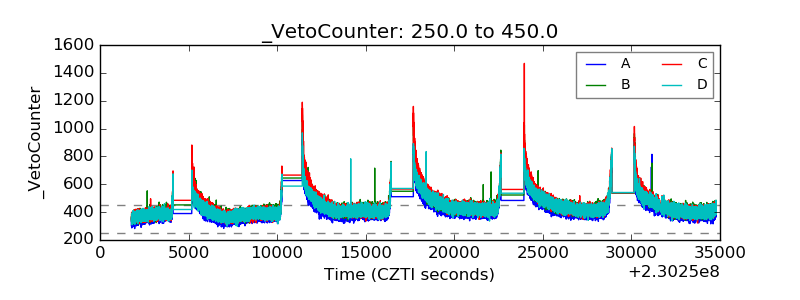 |