| Param | Original file | Final file |
|---|---|---|
| Filename | modeM0/AS1A02_158T01_9000001184cztM0_level2.evt | modeM0/AS1A02_158T01_9000001184cztM0_level2_quad_clean.evt |
| Size (bytes) | 2,213,910,720 | 403,151,040 |
| Size | 2.1 GB | 384.5 MB |
| Events in quadrant A | 15,409,669 | 2,501,464 |
| Events in quadrant B | 16,205,297 | 2,546,943 |
| Events in quadrant C | 15,140,221 | 2,511,445 |
| Events in quadrant D | 18,064,682 | 2,384,708 |
| Mode M0 | |||
|---|---|---|---|
| Quadrant | BADHDUFLAG | Total packets | Discarded packets |
| A | 0 | 68380 | 0 |
| B | 0 | 70164 | 0 |
| C | 0 | 67857 | 0 |
| D | 0 | 76823 | 0 |
| Mode M9 | |||
|---|---|---|---|
| Quadrant | BADHDUFLAG | Total packets | Discarded packets |
| A | 0 | 27 | 0 |
| B | 0 | 27 | 0 |
| C | 0 | 27 | 0 |
| D | 0 | 27 | 0 |
| Mode SS | |||
|---|---|---|---|
| Quadrant | BADHDUFLAG | Total packets | Discarded packets |
| A | 0 | 672 | 0 |
| B | 0 | 672 | 0 |
| C | 0 | 672 | 0 |
| D | 0 | 672 | 0 |
| Quadrant | Total seconds | Saturated seconds | Saturation percentage |
|---|---|---|---|
| A | 32980 | 476 | 1.443299% |
| B | 32975 | 501 | 1.519333% |
| C | 32979 | 242 | 0.733800% |
| D | 32975 | 698 | 2.116755% |
Noise dominated data is calculated using 1-second bins in cleaned event files. If a bin has >2000 counts, and if more than 50% of those come from <1% of pixels, then it is considered to be noise-dominated and hence unusable.
| Quadrant | # 1 sec bins | Bins with >0 counts | Bins with >2000 counts | High rate bins dominated by noise | Noise dominated (total time) | Noise dominated (detector-on time) | Marked lightcurve |
|---|---|---|---|---|---|---|---|
| A | 35858 | 33011 | 12 | 12 | 0.03% | 0.04% |  |
| B | 35858 | 33012 | 15 | 15 | 0.04% | 0.05% |  |
| C | 35858 | 33014 | 14 | 14 | 0.04% | 0.04% | 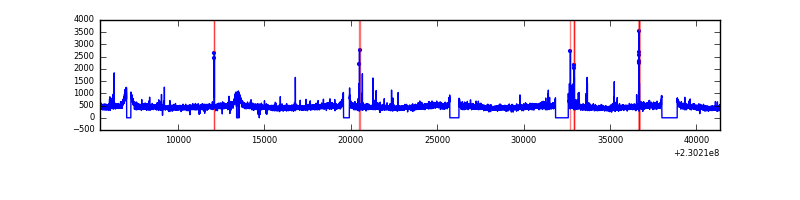 |
| D | 35858 | 33012 | 365 | 365 | 1.02% | 1.11% |  |
Top three noisy pixels from each quadrant. If the there are fewer than three noisy pixels in the level2.evt file, extra rows are filled as -1
| Pixel properties | Quadrant properties | ||||||
|---|---|---|---|---|---|---|---|
| Quadrant | DetID | PixID | Counts | Sigma | Mean | Median | Sigma |
| A | 5 | 16 | 155276 | 190.16 | 3913 | 3828 | 796.4 |
| A | 14 | 111 | 74332 | 88.52 | 3913 | 3828 | 796.4 |
| A | 13 | 251 | 59796 | 70.27 | 3913 | 3828 | 796.4 |
| B | 0 | 214 | 404641 | 535.69 | 3932 | 3831 | 748.2 |
| B | 4 | 81 | 171490 | 224.08 | 3932 | 3831 | 748.2 |
| B | 5 | 255 | 140294 | 182.38 | 3932 | 3831 | 748.2 |
| C | 1 | 16 | 169593 | 186.48 | 3827 | 3844 | 888.8 |
| C | 13 | 61 | 29256 | 28.59 | 3827 | 3844 | 888.8 |
| C | 8 | 128 | 28154 | 27.35 | 3827 | 3844 | 888.8 |
| D | 12 | 221 | 878386 | 939.16 | 3793 | 3675 | 931.4 |
| D | 4 | 95 | 787259 | 841.32 | 3793 | 3675 | 931.4 |
| D | 12 | 227 | 742309 | 793.06 | 3793 | 3675 | 931.4 |
Histogram calculated using DETX and DETY for each event in the final _common_clean file
| Quadrant A |  |
 |
Quadrant B |
|---|---|---|---|
| Quadrant D |  |
 |
Quadrant C |
| Plot type | Count rate plots | Images |
|---|---|---|
| Comparison with Poisson distribution Blue bars denote a histogram of data divided into 1 sec bins. Red curve is a Poisson curve with rate = median count rate of data. |
 |
 |
| Quadrant-wise count rates Data is divided into 100 sec bins |
 |
|
| Module-wise count rates for Quadrant A Data is divided into 100 sec bins |
 |
 |
| Module-wise count rates for Quadrant B Data is divided into 100 sec bins |
 |
 |
| Module-wise count rates for Quadrant C Data is divided into 100 sec bins |
 |
 |
| Module-wise count rates for Quadrant D Data is divided into 100 sec bins |
 |
 |
| Parameter | Plot |
|---|---|
| CZT HV Monitor |  |
| D_VDD |  |
| Temperature 1 |  |
| Veto HV Monitor |  |
| Veto LLD |  |
| Alpha Counter |  |
| _CPM_Rate |  |
| CZT Counter |  |
| +2.5 Volts monitor |  |
| +5 Volts monitor |  |
| _ROLL_ROT |  |
| _Roll_DEC | 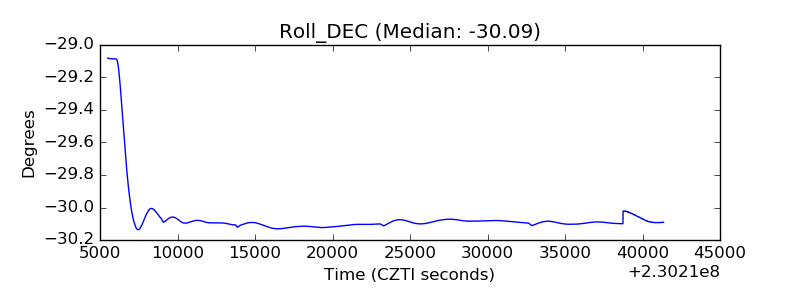 |
| _Roll_RA |  |
| Veto Counter |  |