| Param | Original file | Final file |
|---|---|---|
| Filename | modeM0/AS1G07_027T01_9000001180cztM0_level2.evt | modeM0/AS1G07_027T01_9000001180cztM0_level2_quad_clean.evt |
| Size (bytes) | 984,277,440 | 220,466,880 |
| Size | 938.7 MB | 210.3 MB |
| Events in quadrant A | 6,951,470 | 1,422,257 |
| Events in quadrant B | 7,705,036 | 1,428,462 |
| Events in quadrant C | 6,711,925 | 1,433,521 |
| Events in quadrant D | 7,437,016 | 1,370,695 |
| Mode M9 | |||
|---|---|---|---|
| Quadrant | BADHDUFLAG | Total packets | Discarded packets |
| A | 0 | 24 | 0 |
| B | 0 | 24 | 0 |
| C | 0 | 24 | 0 |
| D | 0 | 24 | 0 |
| Mode M0 | |||
|---|---|---|---|
| Quadrant | BADHDUFLAG | Total packets | Discarded packets |
| A | 0 | 30610 | 0 |
| B | 0 | 32526 | 0 |
| C | 0 | 30102 | 0 |
| D | 0 | 32466 | 0 |
| Mode SS | |||
|---|---|---|---|
| Quadrant | BADHDUFLAG | Total packets | Discarded packets |
| A | 0 | 304 | 0 |
| B | 0 | 304 | 0 |
| C | 0 | 304 | 0 |
| D | 0 | 304 | 0 |
| Quadrant | Total seconds | Saturated seconds | Saturation percentage |
|---|---|---|---|
| A | 14820 | 59 | 0.398111% |
| B | 14820 | 112 | 0.755735% |
| C | 14820 | 35 | 0.236167% |
| D | 14820 | 163 | 1.099865% |
Noise dominated data is calculated using 1-second bins in cleaned event files. If a bin has >2000 counts, and if more than 50% of those come from <1% of pixels, then it is considered to be noise-dominated and hence unusable.
| Quadrant | # 1 sec bins | Bins with >0 counts | Bins with >2000 counts | High rate bins dominated by noise | Noise dominated (total time) | Noise dominated (detector-on time) | Marked lightcurve |
|---|---|---|---|---|---|---|---|
| A | 17265 | 14823 | 9 | 9 | 0.05% | 0.06% | 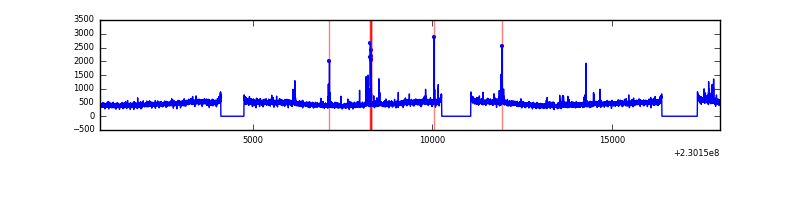 |
| B | 17265 | 14823 | 24 | 24 | 0.14% | 0.16% |  |
| C | 17265 | 14822 | 0 | 0 | 0.00% | 0.00% |  |
| D | 17265 | 14823 | 101 | 101 | 0.58% | 0.68% |  |
Top three noisy pixels from each quadrant. If the there are fewer than three noisy pixels in the level2.evt file, extra rows are filled as -1
| Pixel properties | Quadrant properties | ||||||
|---|---|---|---|---|---|---|---|
| Quadrant | DetID | PixID | Counts | Sigma | Mean | Median | Sigma |
| A | 5 | 16 | 127387 | 347.11 | 1765 | 1730 | 362.0 |
| A | 13 | 248 | 20011 | 50.5 | 1765 | 1730 | 362.0 |
| A | 0 | 226 | 16338 | 40.35 | 1765 | 1730 | 362.0 |
| B | 4 | 48 | 350616 | 1047.72 | 1768 | 1728 | 333.0 |
| B | 0 | 214 | 233986 | 697.48 | 1768 | 1728 | 333.0 |
| B | 5 | 255 | 72537 | 212.64 | 1768 | 1728 | 333.0 |
| C | 13 | 61 | 12834 | 28.01 | 1716 | 1730 | 396.4 |
| C | 8 | 128 | 8381 | 16.78 | 1716 | 1730 | 396.4 |
| C | 12 | 4 | 7805 | 15.33 | 1716 | 1730 | 396.4 |
| D | 4 | 95 | 249640 | 553.61 | 1688 | 1649 | 447.9 |
| D | 7 | 71 | 178396 | 394.57 | 1688 | 1649 | 447.9 |
| D | 2 | 14 | 137526 | 303.33 | 1688 | 1649 | 447.9 |
Histogram calculated using DETX and DETY for each event in the final _common_clean file
| Quadrant A |  |
 |
Quadrant B |
|---|---|---|---|
| Quadrant D | 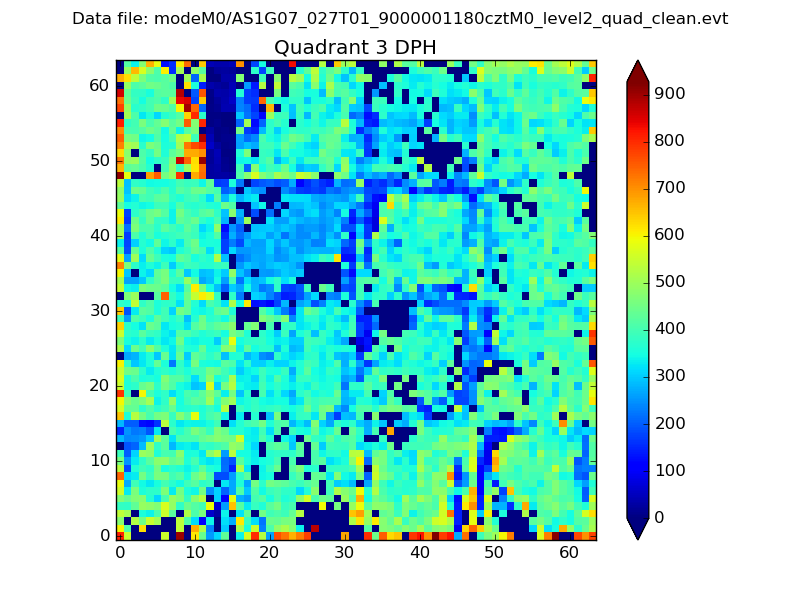 |
 |
Quadrant C |
| Plot type | Count rate plots | Images |
|---|---|---|
| Comparison with Poisson distribution Blue bars denote a histogram of data divided into 1 sec bins. Red curve is a Poisson curve with rate = median count rate of data. |
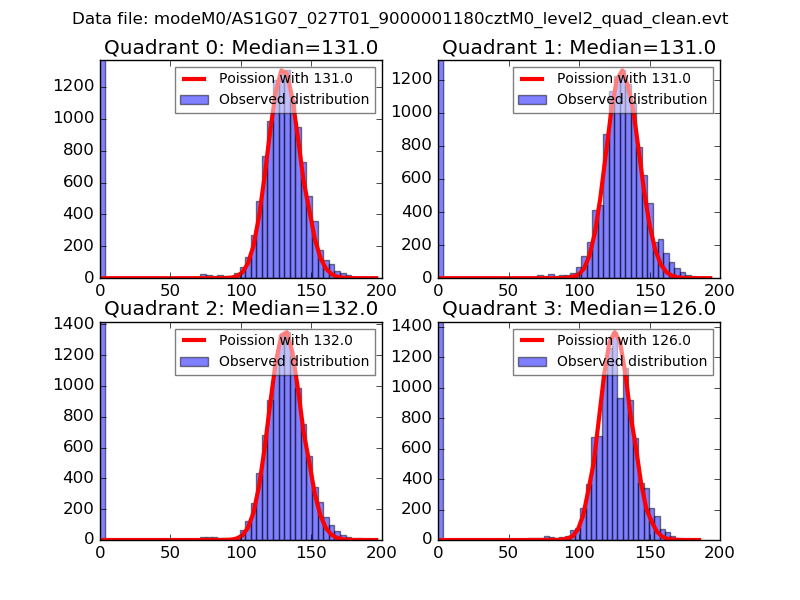 |
 |
| Quadrant-wise count rates Data is divided into 100 sec bins |
 |
|
| Module-wise count rates for Quadrant A Data is divided into 100 sec bins |
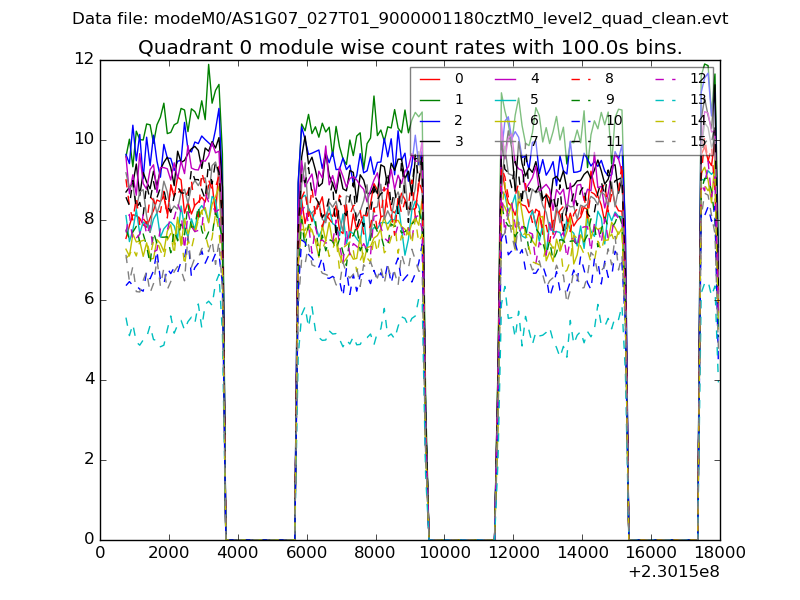 |
 |
| Module-wise count rates for Quadrant B Data is divided into 100 sec bins |
 |
 |
| Module-wise count rates for Quadrant C Data is divided into 100 sec bins |
 |
 |
| Module-wise count rates for Quadrant D Data is divided into 100 sec bins |
 |
 |
| Parameter | Plot |
|---|---|
| CZT HV Monitor |  |
| D_VDD |  |
| Temperature 1 |  |
| Veto HV Monitor |  |
| Veto LLD |  |
| Alpha Counter | 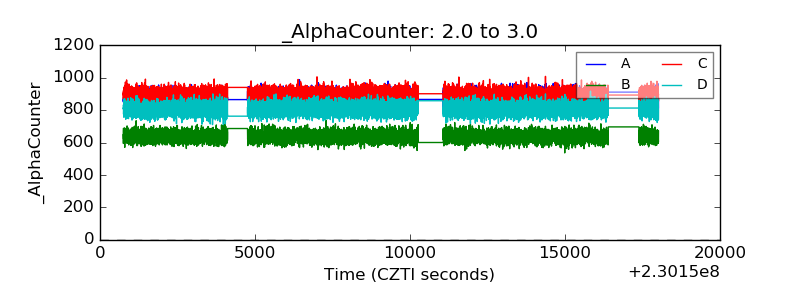 |
| _CPM_Rate |  |
| CZT Counter |  |
| +2.5 Volts monitor |  |
| +5 Volts monitor |  |
| _ROLL_ROT |  |
| _Roll_DEC |  |
| _Roll_RA |  |
| Veto Counter |  |