| Param | Original file | Final file |
|---|---|---|
| Filename | modeM0/AS1C02_033T01_9000001178cztM0_level2.evt | modeM0/AS1C02_033T01_9000001178cztM0_level2_quad_clean.evt |
| Size (bytes) | 1,489,982,400 | 250,971,840 |
| Size | 1.4 GB | 239.3 MB |
| Events in quadrant A | 10,744,213 | 1,531,033 |
| Events in quadrant B | 11,459,832 | 1,568,400 |
| Events in quadrant C | 10,212,118 | 1,547,856 |
| Events in quadrant D | 11,249,770 | 1,468,395 |
| Mode M0 | |||
|---|---|---|---|
| Quadrant | BADHDUFLAG | Total packets | Discarded packets |
| A | 0 | 46691 | 0 |
| B | 0 | 48046 | 0 |
| C | 0 | 45218 | 0 |
| D | 0 | 48672 | 0 |
| Mode M9 | |||
|---|---|---|---|
| Quadrant | BADHDUFLAG | Total packets | Discarded packets |
| A | 0 | 9 | 0 |
| B | 0 | 9 | 0 |
| C | 0 | 9 | 0 |
| D | 0 | 9 | 0 |
| Mode SS | |||
|---|---|---|---|
| Quadrant | BADHDUFLAG | Total packets | Discarded packets |
| A | 0 | 438 | 0 |
| B | 0 | 438 | 0 |
| C | 0 | 438 | 0 |
| D | 0 | 438 | 0 |
| Quadrant | Total seconds | Saturated seconds | Saturation percentage |
|---|---|---|---|
| A | 21570 | 563 | 2.610107% |
| B | 21569 | 572 | 2.651954% |
| C | 21570 | 225 | 1.043115% |
| D | 21570 | 449 | 2.081595% |
Noise dominated data is calculated using 1-second bins in cleaned event files. If a bin has >2000 counts, and if more than 50% of those come from <1% of pixels, then it is considered to be noise-dominated and hence unusable.
| Quadrant | # 1 sec bins | Bins with >0 counts | Bins with >2000 counts | High rate bins dominated by noise | Noise dominated (total time) | Noise dominated (detector-on time) | Marked lightcurve |
|---|---|---|---|---|---|---|---|
| A | 22531 | 21576 | 77 | 77 | 0.34% | 0.36% |  |
| B | 22531 | 21576 | 28 | 28 | 0.12% | 0.13% | 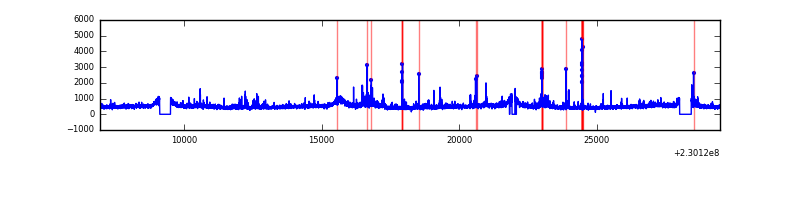 |
| C | 22531 | 21576 | 7 | 7 | 0.03% | 0.03% |  |
| D | 22531 | 21574 | 181 | 181 | 0.80% | 0.84% |  |
Top three noisy pixels from each quadrant. If the there are fewer than three noisy pixels in the level2.evt file, extra rows are filled as -1
| Pixel properties | Quadrant properties | ||||||
|---|---|---|---|---|---|---|---|
| Quadrant | DetID | PixID | Counts | Sigma | Mean | Median | Sigma |
| A | 5 | 16 | 485758 | 890.1 | 2644 | 2579 | 542.8 |
| A | 14 | 111 | 66393 | 117.56 | 2644 | 2579 | 542.8 |
| A | 0 | 254 | 27112 | 45.19 | 2644 | 2579 | 542.8 |
| B | 0 | 219 | 261599 | 506.48 | 2670 | 2605 | 511.4 |
| B | 0 | 214 | 217534 | 420.31 | 2670 | 2605 | 511.4 |
| B | 0 | 231 | 173574 | 334.34 | 2670 | 2605 | 511.4 |
| C | 1 | 16 | 92764 | 149.4 | 2579 | 2590 | 603.6 |
| C | 8 | 128 | 30701 | 46.58 | 2579 | 2590 | 603.6 |
| C | 13 | 61 | 20020 | 28.88 | 2579 | 2590 | 603.6 |
| D | 7 | 71 | 441480 | 654.68 | 2541 | 2478 | 670.6 |
| D | 2 | 14 | 268250 | 396.34 | 2541 | 2478 | 670.6 |
| D | 1 | 7 | 235760 | 347.89 | 2541 | 2478 | 670.6 |
Histogram calculated using DETX and DETY for each event in the final _common_clean file
| Quadrant A |  |
 |
Quadrant B |
|---|---|---|---|
| Quadrant D |  |
 |
Quadrant C |
| Plot type | Count rate plots | Images |
|---|---|---|
| Comparison with Poisson distribution Blue bars denote a histogram of data divided into 1 sec bins. Red curve is a Poisson curve with rate = median count rate of data. |
 |
 |
| Quadrant-wise count rates Data is divided into 100 sec bins |
 |
|
| Module-wise count rates for Quadrant A Data is divided into 100 sec bins |
 |
 |
| Module-wise count rates for Quadrant B Data is divided into 100 sec bins |
 |
 |
| Module-wise count rates for Quadrant C Data is divided into 100 sec bins |
 |
 |
| Module-wise count rates for Quadrant D Data is divided into 100 sec bins |
 |
 |
| Parameter | Plot |
|---|---|
| CZT HV Monitor |  |
| D_VDD |  |
| Temperature 1 | 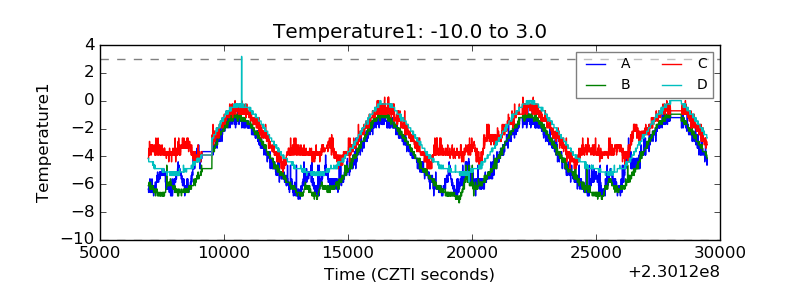 |
| Veto HV Monitor |  |
| Veto LLD | 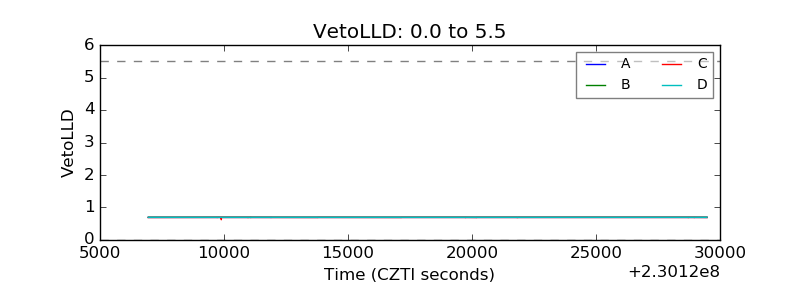 |
| Alpha Counter |  |
| _CPM_Rate | 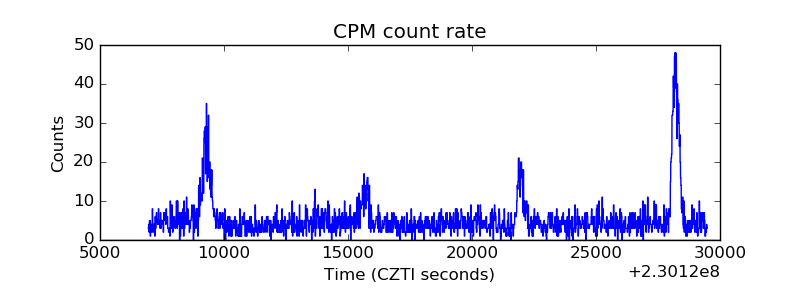 |
| CZT Counter |  |
| +2.5 Volts monitor |  |
| +5 Volts monitor |  |
| _ROLL_ROT |  |
| _Roll_DEC |  |
| _Roll_RA |  |
| Veto Counter |  |