| Param | Original file | Final file |
|---|---|---|
| Filename | modeM0/AS1A03_025T07_9000001182cztM0_level2.evt | modeM0/AS1A03_025T07_9000001182cztM0_level2_quad_clean.evt |
| Size (bytes) | 2,532,686,400 | 469,592,640 |
| Size | 2.4 GB | 447.8 MB |
| Events in quadrant A | 17,839,524 | 2,963,000 |
| Events in quadrant B | 18,541,385 | 3,008,064 |
| Events in quadrant C | 17,195,792 | 2,910,803 |
| Events in quadrant D | 20,611,803 | 2,785,178 |
| Mode SS | |||
|---|---|---|---|
| Quadrant | BADHDUFLAG | Total packets | Discarded packets |
| A | 0 | 762 | 0 |
| B | 0 | 764 | 0 |
| C | 0 | 758 | 0 |
| D | 0 | 758 | 0 |
| Mode M0 | |||
|---|---|---|---|
| Quadrant | BADHDUFLAG | Total packets | Discarded packets |
| A | 0 | 77147 | 0 |
| B | 0 | 78351 | 0 |
| C | 0 | 76329 | 0 |
| D | 0 | 86512 | 0 |
| Mode M9 | |||
|---|---|---|---|
| Quadrant | BADHDUFLAG | Total packets | Discarded packets |
| A | 0 | 78 | 0 |
| B | 0 | 78 | 0 |
| C | 0 | 78 | 0 |
| D | 0 | 78 | 0 |
| Quadrant | Total seconds | Saturated seconds | Saturation percentage |
|---|---|---|---|
| A | 37217 | 508 | 1.364968% |
| B | 37214 | 519 | 1.394636% |
| C | 37210 | 308 | 0.827734% |
| D | 37217 | 1016 | 2.729935% |
Noise dominated data is calculated using 1-second bins in cleaned event files. If a bin has >2000 counts, and if more than 50% of those come from <1% of pixels, then it is considered to be noise-dominated and hence unusable.
| Quadrant | # 1 sec bins | Bins with >0 counts | Bins with >2000 counts | High rate bins dominated by noise | Noise dominated (total time) | Noise dominated (detector-on time) | Marked lightcurve |
|---|---|---|---|---|---|---|---|
| A | 45298 | 37300 | 23 | 23 | 0.05% | 0.06% |  |
| B | 45298 | 37299 | 21 | 21 | 0.05% | 0.06% | 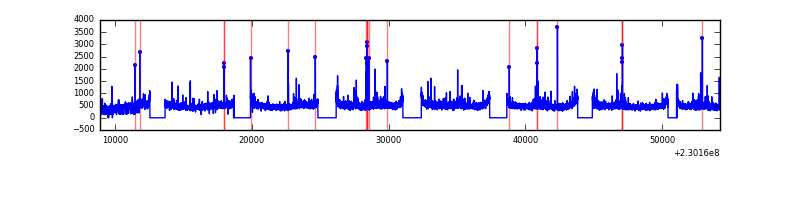 |
| C | 45298 | 37301 | 2 | 2 | 0.00% | 0.01% |  |
| D | 45298 | 37302 | 555 | 555 | 1.23% | 1.49% |  |
Top three noisy pixels from each quadrant. If the there are fewer than three noisy pixels in the level2.evt file, extra rows are filled as -1
| Pixel properties | Quadrant properties | ||||||
|---|---|---|---|---|---|---|---|
| Quadrant | DetID | PixID | Counts | Sigma | Mean | Median | Sigma |
| A | 4 | 2 | 137344 | 146.26 | 4544 | 4449 | 908.6 |
| A | 14 | 111 | 93160 | 97.63 | 4544 | 4449 | 908.6 |
| A | 13 | 251 | 53849 | 54.37 | 4544 | 4449 | 908.6 |
| B | 0 | 214 | 566680 | 664.06 | 4552 | 4443 | 846.7 |
| B | 4 | 81 | 100677 | 113.66 | 4552 | 4443 | 846.7 |
| B | 12 | 111 | 92604 | 104.13 | 4552 | 4443 | 846.7 |
| C | 1 | 16 | 60751 | 55.84 | 4388 | 4414 | 1008.8 |
| C | 13 | 61 | 32829 | 28.17 | 4388 | 4414 | 1008.8 |
| C | 8 | 222 | 20560 | 16.0 | 4388 | 4414 | 1008.8 |
| D | 7 | 71 | 1190803 | 1066.11 | 4324 | 4228 | 1113.0 |
| D | 1 | 52 | 863987 | 772.47 | 4324 | 4228 | 1113.0 |
| D | 4 | 95 | 416859 | 370.74 | 4324 | 4228 | 1113.0 |
Histogram calculated using DETX and DETY for each event in the final _common_clean file
| Quadrant A |  |
 |
Quadrant B |
|---|---|---|---|
| Quadrant D |  |
 |
Quadrant C |
| Plot type | Count rate plots | Images |
|---|---|---|
| Comparison with Poisson distribution Blue bars denote a histogram of data divided into 1 sec bins. Red curve is a Poisson curve with rate = median count rate of data. |
 |
 |
| Quadrant-wise count rates Data is divided into 100 sec bins |
 |
|
| Module-wise count rates for Quadrant A Data is divided into 100 sec bins |
 |
 |
| Module-wise count rates for Quadrant B Data is divided into 100 sec bins |
 |
 |
| Module-wise count rates for Quadrant C Data is divided into 100 sec bins |
 |
 |
| Module-wise count rates for Quadrant D Data is divided into 100 sec bins |
 |
 |
| Parameter | Plot |
|---|---|
| CZT HV Monitor |  |
| D_VDD |  |
| Temperature 1 |  |
| Veto HV Monitor |  |
| Veto LLD |  |
| Alpha Counter |  |
| _CPM_Rate |  |
| CZT Counter |  |
| +2.5 Volts monitor |  |
| +5 Volts monitor |  |
| _ROLL_ROT |  |
| _Roll_DEC |  |
| _Roll_RA | 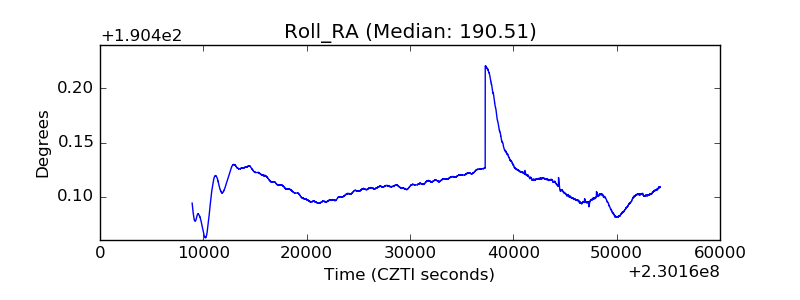 |
| Veto Counter |  |