| Param | Original file | Final file |
|---|---|---|
| Filename | modeM0/AS1G07_084T03_9000001174cztM0_level2.evt | modeM0/AS1G07_084T03_9000001174cztM0_level2_quad_clean.evt |
| Size (bytes) | 1,333,278,720 | 381,680,640 |
| Size | 1.2 GB | 364.0 MB |
| Events in quadrant A | 9,461,705 | 2,509,593 |
| Events in quadrant B | 9,797,900 | 2,558,493 |
| Events in quadrant C | 9,350,579 | 2,550,167 |
| Events in quadrant D | 10,322,583 | 2,473,157 |
| Mode M0 | |||
|---|---|---|---|
| Quadrant | BADHDUFLAG | Total packets | Discarded packets |
| A | 0 | 43710 | 0 |
| B | 0 | 44102 | 0 |
| C | 0 | 43430 | 0 |
| D | 0 | 46624 | 0 |
| Mode M9 | |||
|---|---|---|---|
| Quadrant | BADHDUFLAG | Total packets | Discarded packets |
| A | 0 | 25 | 0 |
| B | 0 | 25 | 0 |
| C | 0 | 25 | 0 |
| D | 0 | 25 | 0 |
| Mode SS | |||
|---|---|---|---|
| Quadrant | BADHDUFLAG | Total packets | Discarded packets |
| A | 0 | 434 | 0 |
| B | 0 | 434 | 0 |
| C | 0 | 434 | 0 |
| D | 0 | 434 | 0 |
| Quadrant | Total seconds | Saturated seconds | Saturation percentage |
|---|---|---|---|
| A | 21365 | 126 | 0.589750% |
| B | 21365 | 124 | 0.580388% |
| C | 21365 | 86 | 0.402527% |
| D | 21365 | 199 | 0.931430% |
Noise dominated data is calculated using 1-second bins in cleaned event files. If a bin has >2000 counts, and if more than 50% of those come from <1% of pixels, then it is considered to be noise-dominated and hence unusable.
| Quadrant | # 1 sec bins | Bins with >0 counts | Bins with >2000 counts | High rate bins dominated by noise | Noise dominated (total time) | Noise dominated (detector-on time) | Marked lightcurve |
|---|---|---|---|---|---|---|---|
| A | 23875 | 21369 | 34 | 34 | 0.14% | 0.16% |  |
| B | 23875 | 21369 | 1 | 1 | 0.00% | 0.00% |  |
| C | 23875 | 21369 | 4 | 4 | 0.02% | 0.02% |  |
| D | 23875 | 21369 | 118 | 118 | 0.49% | 0.55% |  |
Top three noisy pixels from each quadrant. If the there are fewer than three noisy pixels in the level2.evt file, extra rows are filled as -1
| Pixel properties | Quadrant properties | ||||||
|---|---|---|---|---|---|---|---|
| Quadrant | DetID | PixID | Counts | Sigma | Mean | Median | Sigma |
| A | 15 | 236 | 127504 | 254.87 | 2421 | 2360 | 491.0 |
| A | 0 | 226 | 22440 | 40.9 | 2421 | 2360 | 491.0 |
| A | 12 | 194 | 21938 | 39.87 | 2421 | 2360 | 491.0 |
| B | 0 | 214 | 114999 | 243.11 | 2445 | 2378 | 463.2 |
| B | 4 | 48 | 50865 | 104.67 | 2445 | 2378 | 463.2 |
| B | 12 | 111 | 50643 | 104.19 | 2445 | 2378 | 463.2 |
| C | 1 | 16 | 56099 | 98.2 | 2377 | 2385 | 547.0 |
| C | 13 | 61 | 18276 | 29.05 | 2377 | 2385 | 547.0 |
| C | 8 | 128 | 11124 | 15.98 | 2377 | 2385 | 547.0 |
| D | 2 | 14 | 383563 | 610.35 | 2346 | 2292 | 624.7 |
| D | 1 | 52 | 231990 | 367.71 | 2346 | 2292 | 624.7 |
| D | 12 | 233 | 213596 | 338.26 | 2346 | 2292 | 624.7 |
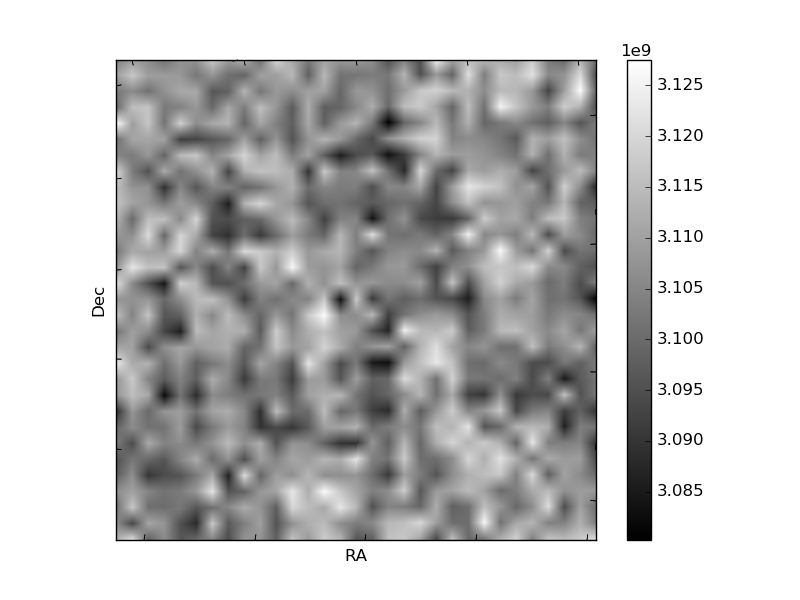
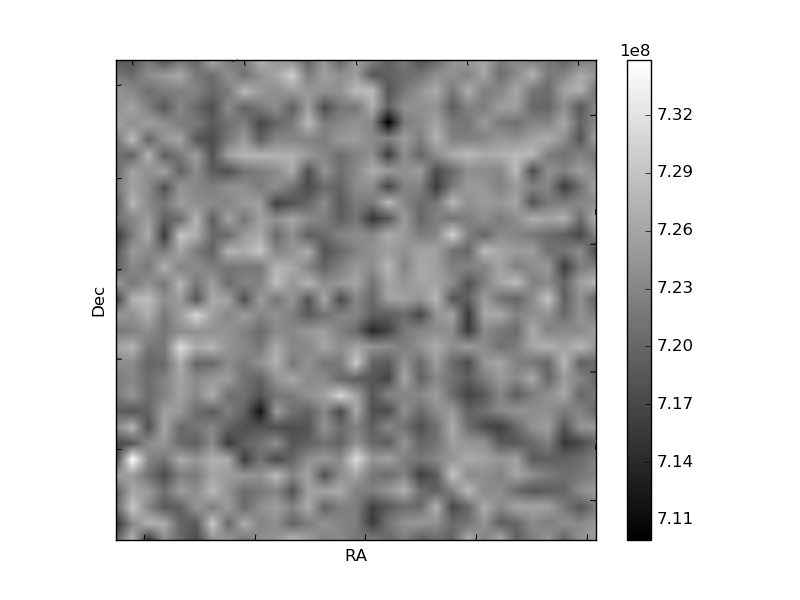
Histogram calculated using DETX and DETY for each event in the final _common_clean file
| Quadrant A |  |
 |
Quadrant B |
|---|---|---|---|
| Quadrant D |  |
 |
Quadrant C |
| Plot type | Count rate plots | Images |
|---|---|---|
| Comparison with Poisson distribution Blue bars denote a histogram of data divided into 1 sec bins. Red curve is a Poisson curve with rate = median count rate of data. |
 |
 |
| Quadrant-wise count rates Data is divided into 100 sec bins |
 |
|
| Module-wise count rates for Quadrant A Data is divided into 100 sec bins |
 |
 |
| Module-wise count rates for Quadrant B Data is divided into 100 sec bins |
 |
 |
| Module-wise count rates for Quadrant C Data is divided into 100 sec bins |
 |
 |
| Module-wise count rates for Quadrant D Data is divided into 100 sec bins |
 |
 |
| Parameter | Plot |
|---|---|
| CZT HV Monitor |  |
| D_VDD |  |
| Temperature 1 |  |
| Veto HV Monitor | 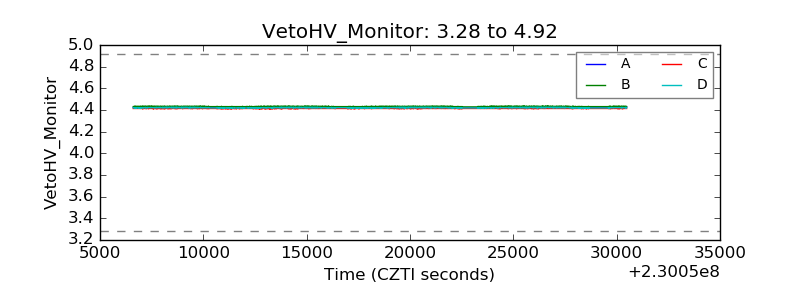 |
| Veto LLD |  |
| Alpha Counter |  |
| _CPM_Rate |  |
| CZT Counter |  |
| +2.5 Volts monitor |  |
| +5 Volts monitor |  |
| _ROLL_ROT |  |
| _Roll_DEC |  |
| _Roll_RA |  |
| Veto Counter |  |