| Param | Original file | Final file |
|---|---|---|
| Filename | modeM0/AS1G07_076T04_9000001172cztM0_level2.evt | modeM0/AS1G07_076T04_9000001172cztM0_level2_quad_clean.evt |
| Size (bytes) | 979,626,240 | 172,074,240 |
| Size | 934.2 MB | 164.1 MB |
| Events in quadrant A | 6,893,112 | 1,063,662 |
| Events in quadrant B | 7,826,983 | 1,066,917 |
| Events in quadrant C | 6,851,330 | 1,046,903 |
| Events in quadrant D | 7,105,095 | 1,023,786 |
| Mode M9 | |||
|---|---|---|---|
| Quadrant | BADHDUFLAG | Total packets | Discarded packets |
| A | 0 | 8 | 0 |
| B | 0 | 8 | 0 |
| C | 0 | 8 | 0 |
| D | 0 | 8 | 0 |
| Mode SS | |||
|---|---|---|---|
| Quadrant | BADHDUFLAG | Total packets | Discarded packets |
| A | 0 | 298 | 0 |
| B | 0 | 298 | 0 |
| C | 0 | 298 | 0 |
| D | 0 | 298 | 0 |
| Mode M0 | |||
|---|---|---|---|
| Quadrant | BADHDUFLAG | Total packets | Discarded packets |
| A | 0 | 30545 | 0 |
| B | 0 | 32855 | 0 |
| C | 0 | 30572 | 0 |
| D | 0 | 31455 | 0 |
| Quadrant | Total seconds | Saturated seconds | Saturation percentage |
|---|---|---|---|
| A | 14633 | 489 | 3.341762% |
| B | 14633 | 563 | 3.847468% |
| C | 14633 | 352 | 2.405522% |
| D | 14633 | 368 | 2.514864% |
Noise dominated data is calculated using 1-second bins in cleaned event files. If a bin has >2000 counts, and if more than 50% of those come from <1% of pixels, then it is considered to be noise-dominated and hence unusable.
| Quadrant | # 1 sec bins | Bins with >0 counts | Bins with >2000 counts | High rate bins dominated by noise | Noise dominated (total time) | Noise dominated (detector-on time) | Marked lightcurve |
|---|---|---|---|---|---|---|---|
| A | 15433 | 14634 | 0 | 0 | 0.00% | 0.00% | 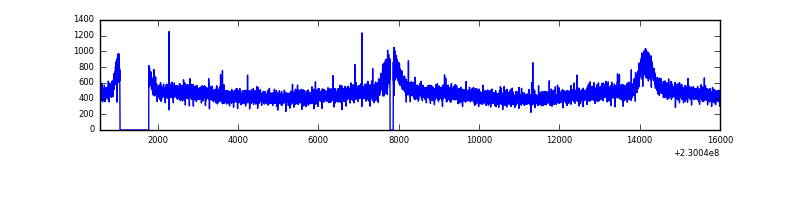 |
| B | 15433 | 14634 | 38 | 38 | 0.25% | 0.26% |  |
| C | 15433 | 14635 | 4 | 4 | 0.03% | 0.03% |  |
| D | 15433 | 14635 | 27 | 27 | 0.17% | 0.18% |  |
Top three noisy pixels from each quadrant. If the there are fewer than three noisy pixels in the level2.evt file, extra rows are filled as -1
| Pixel properties | Quadrant properties | ||||||
|---|---|---|---|---|---|---|---|
| Quadrant | DetID | PixID | Counts | Sigma | Mean | Median | Sigma |
| A | 0 | 226 | 16606 | 40.68 | 1790 | 1746 | 365.3 |
| A | 12 | 194 | 16098 | 39.29 | 1790 | 1746 | 365.3 |
| A | 15 | 236 | 8484 | 18.45 | 1790 | 1746 | 365.3 |
| B | 4 | 48 | 605337 | 1746.73 | 1790 | 1748 | 345.6 |
| B | 0 | 214 | 125855 | 359.15 | 1790 | 1748 | 345.6 |
| B | 4 | 81 | 54854 | 153.68 | 1790 | 1748 | 345.6 |
| C | 1 | 16 | 24821 | 56.86 | 1742 | 1744 | 405.9 |
| C | 8 | 128 | 20442 | 46.07 | 1742 | 1744 | 405.9 |
| C | 13 | 61 | 13333 | 28.55 | 1742 | 1744 | 405.9 |
| D | 1 | 52 | 118379 | 250.96 | 1733 | 1686 | 465.0 |
| D | 2 | 14 | 88306 | 186.29 | 1733 | 1686 | 465.0 |
| D | 12 | 233 | 71733 | 150.64 | 1733 | 1686 | 465.0 |
Histogram calculated using DETX and DETY for each event in the final _common_clean file
| Quadrant A | 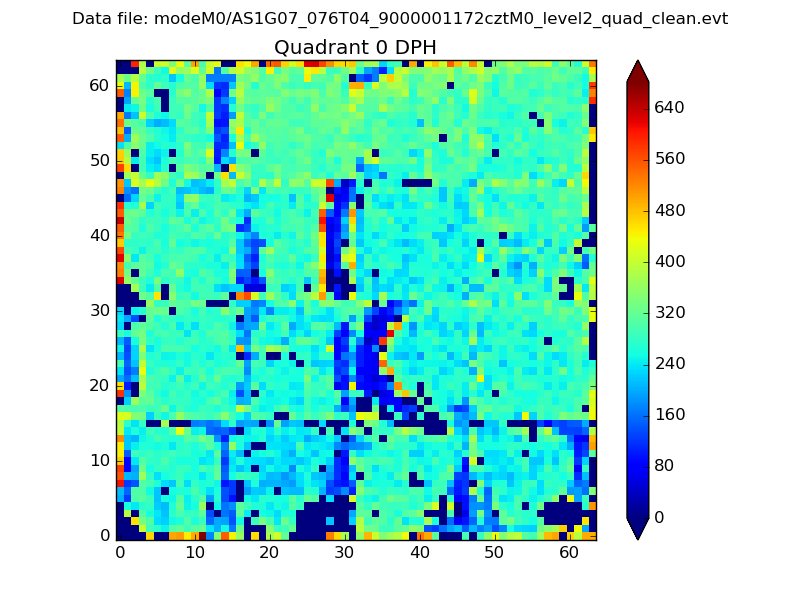 |
 |
Quadrant B |
|---|---|---|---|
| Quadrant D |  |
 |
Quadrant C |
| Plot type | Count rate plots | Images |
|---|---|---|
| Comparison with Poisson distribution Blue bars denote a histogram of data divided into 1 sec bins. Red curve is a Poisson curve with rate = median count rate of data. |
 |
 |
| Quadrant-wise count rates Data is divided into 100 sec bins |
 |
|
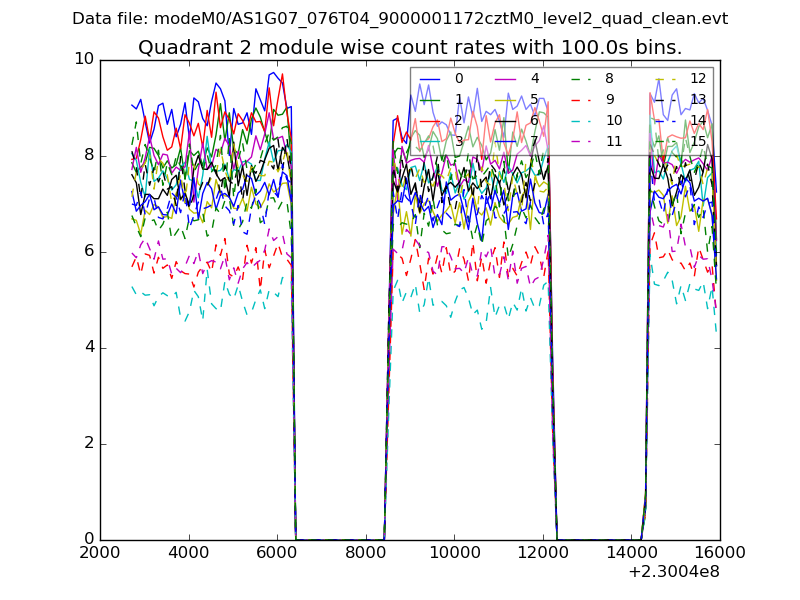
| Module-wise count rates for Quadrant A Data is divided into 100 sec bins |
 |
 |
| Module-wise count rates for Quadrant B Data is divided into 100 sec bins |
 |
 |
| Module-wise count rates for Quadrant C Data is divided into 100 sec bins |
 |
 |
| Module-wise count rates for Quadrant D Data is divided into 100 sec bins |
 |
 |
| Parameter | Plot |
|---|---|
| CZT HV Monitor | 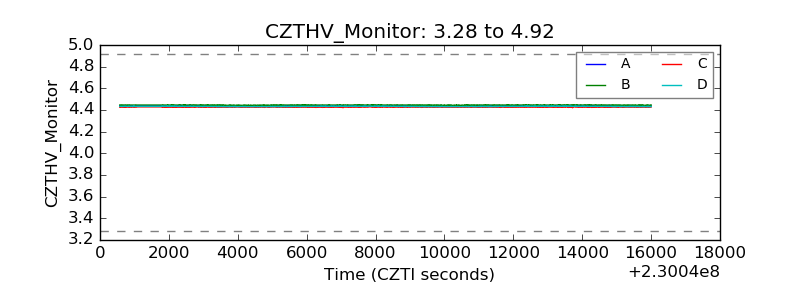 |
| D_VDD |  |
| Temperature 1 | 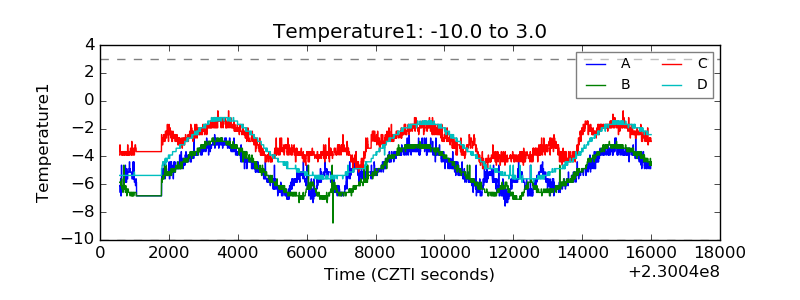 |
| Veto HV Monitor |  |
| Veto LLD | 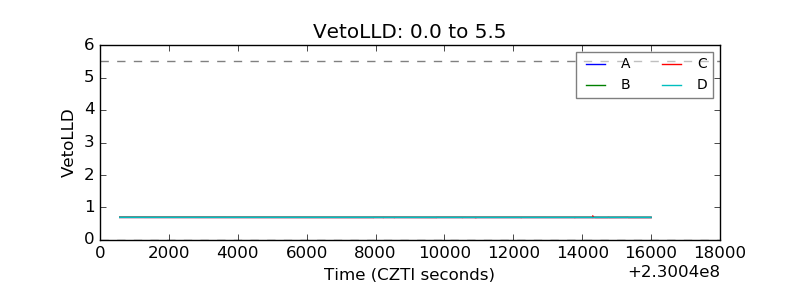 |
| Alpha Counter |  |
| _CPM_Rate |  |
| CZT Counter | 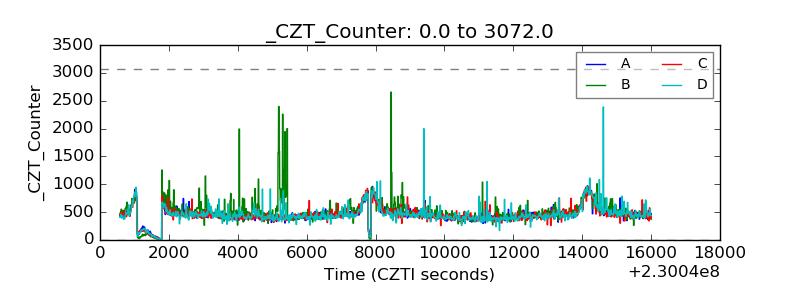 |
| +2.5 Volts monitor | 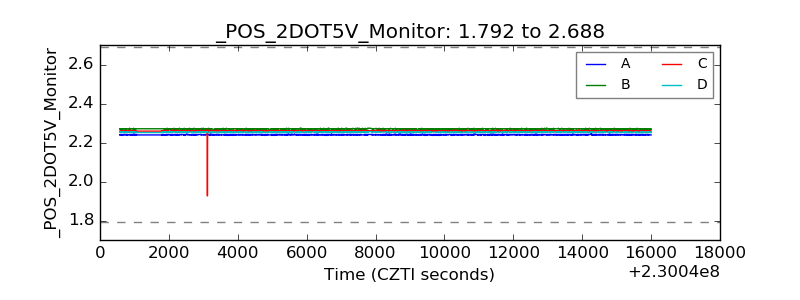 |
| +5 Volts monitor | 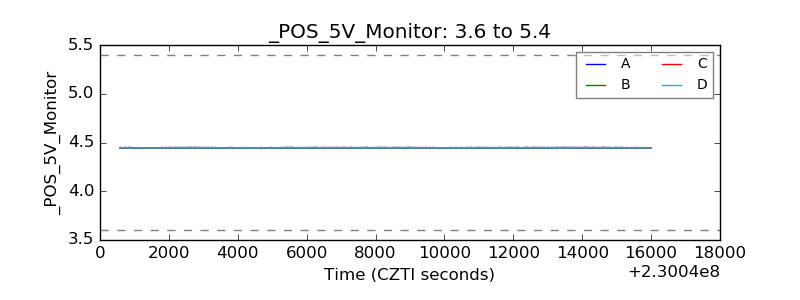 |
| _ROLL_ROT |  |
| _Roll_DEC |  |
| _Roll_RA |  |
| Veto Counter |  |