| Param | Original file | Final file |
|---|---|---|
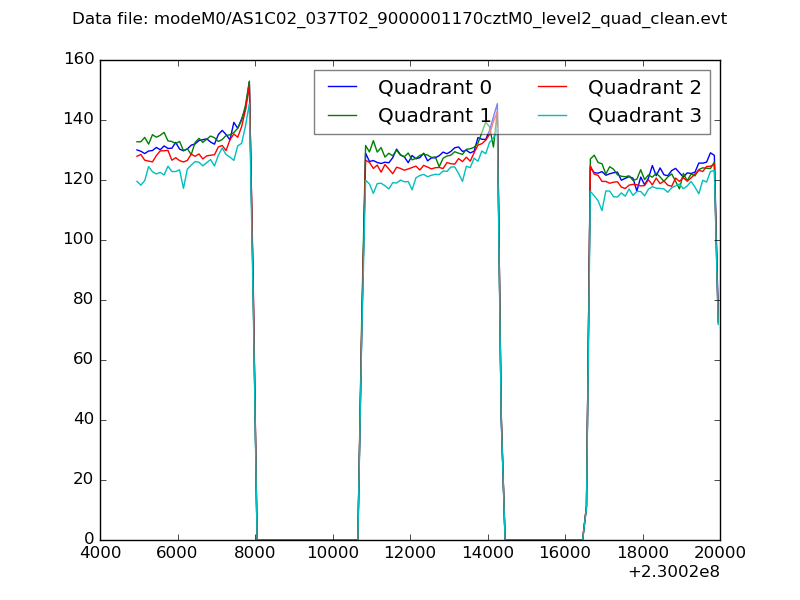
| Filename | modeM0/AS1C02_037T02_9000001170cztM0_level2.evt | modeM0/AS1C02_037T02_9000001170cztM0_level2_quad_clean.evt |
| Size (bytes) | 992,350,080 | 200,073,600 |
| Size | 946.4 MB | 190.8 MB |
| Events in quadrant A | 7,140,623 | 1,286,623 |
| Events in quadrant B | 7,683,143 | 1,291,232 |
| Events in quadrant C | 6,834,831 | 1,259,694 |
| Events in quadrant D | 7,411,096 | 1,218,855 |
| Mode M9 | |||
|---|---|---|---|
| Quadrant | BADHDUFLAG | Total packets | Discarded packets |
| A | 0 | 36 | 0 |
| B | 0 | 36 | 0 |
| C | 0 | 36 | 0 |
| D | 0 | 36 | 0 |
| Mode M0 | |||
|---|---|---|---|
| Quadrant | BADHDUFLAG | Total packets | Discarded packets |
| A | 0 | 30263 | 0 |
| B | 0 | 31577 | 0 |
| C | 0 | 29891 | 0 |
| D | 0 | 31643 | 0 |
| Mode SS | |||
|---|---|---|---|
| Quadrant | BADHDUFLAG | Total packets | Discarded packets |
| A | 0 | 296 | 0 |
| B | 0 | 296 | 0 |
| C | 0 | 296 | 0 |
| D | 0 | 296 | 0 |
| Quadrant | Total seconds | Saturated seconds | Saturation percentage |
|---|---|---|---|
| A | 14540 | 180 | 1.237964% |
| B | 14540 | 226 | 1.554333% |
| C | 14540 | 93 | 0.639615% |
| D | 14540 | 191 | 1.313618% |
Noise dominated data is calculated using 1-second bins in cleaned event files. If a bin has >2000 counts, and if more than 50% of those come from <1% of pixels, then it is considered to be noise-dominated and hence unusable.
| Quadrant | # 1 sec bins | Bins with >0 counts | Bins with >2000 counts | High rate bins dominated by noise | Noise dominated (total time) | Noise dominated (detector-on time) | Marked lightcurve |
|---|---|---|---|---|---|---|---|
| A | 16955 | 14543 | 1 | 1 | 0.01% | 0.01% |  |
| B | 16955 | 14542 | 27 | 27 | 0.16% | 0.19% |  |
| C | 16955 | 14543 | 0 | 0 | 0.00% | 0.00% |  |
| D | 16955 | 14543 | 67 | 67 | 0.40% | 0.46% |  |
Top three noisy pixels from each quadrant. If the there are fewer than three noisy pixels in the level2.evt file, extra rows are filled as -1
| Pixel properties | Quadrant properties | ||||||
|---|---|---|---|---|---|---|---|
| Quadrant | DetID | PixID | Counts | Sigma | Mean | Median | Sigma |
| A | 14 | 111 | 46074 | 119.95 | 1829 | 1793 | 369.1 |
| A | 0 | 226 | 17407 | 42.3 | 1829 | 1793 | 369.1 |
| A | 12 | 194 | 16245 | 39.15 | 1829 | 1793 | 369.1 |
| B | 0 | 214 | 199411 | 575.29 | 1826 | 1790 | 343.5 |
| B | 4 | 48 | 132571 | 380.71 | 1826 | 1790 | 343.5 |
| B | 10 | 16 | 102984 | 294.58 | 1826 | 1790 | 343.5 |
| C | 13 | 61 | 13425 | 28.78 | 1752 | 1765 | 405.2 |
| C | 1 | 16 | 4493 | 6.73 | 1752 | 1765 | 405.2 |
| C | 3 | 202 | 4425 | 6.57 | 1752 | 1765 | 405.2 |
| D | 14 | 34 | 202809 | 470.9 | 1758 | 1710 | 427.1 |
| D | 7 | 71 | 137689 | 318.41 | 1758 | 1710 | 427.1 |
| D | 2 | 14 | 137081 | 316.99 | 1758 | 1710 | 427.1 |
Histogram calculated using DETX and DETY for each event in the final _common_clean file
| Quadrant A |  |
 |
Quadrant B |
|---|---|---|---|
| Quadrant D |  |
 |
Quadrant C |
| Plot type | Count rate plots | Images |
|---|---|---|
| Comparison with Poisson distribution Blue bars denote a histogram of data divided into 1 sec bins. Red curve is a Poisson curve with rate = median count rate of data. |
 |
 |
| Quadrant-wise count rates Data is divided into 100 sec bins |
 |
|
| Module-wise count rates for Quadrant A Data is divided into 100 sec bins |
 |
 |
| Module-wise count rates for Quadrant B Data is divided into 100 sec bins |
 |
 |
| Module-wise count rates for Quadrant C Data is divided into 100 sec bins |
 |
 |
| Module-wise count rates for Quadrant D Data is divided into 100 sec bins |
 |
 |
| Parameter | Plot |
|---|---|
| CZT HV Monitor |  |
| D_VDD |  |
| Temperature 1 |  |
| Veto HV Monitor | 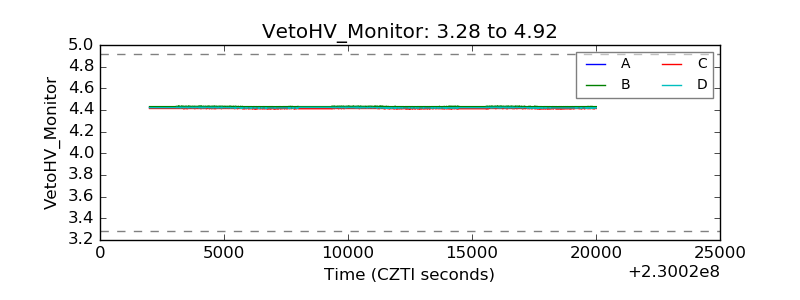 |
| Veto LLD | 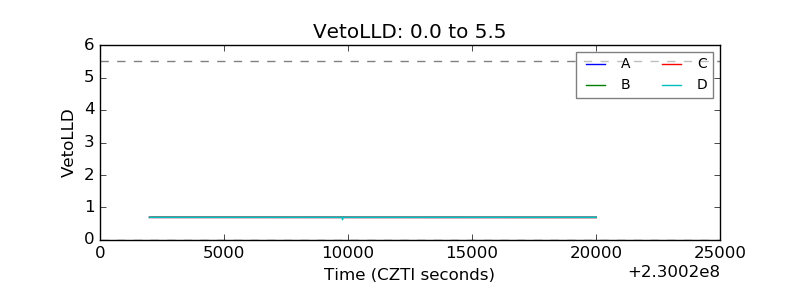 |
| Alpha Counter | 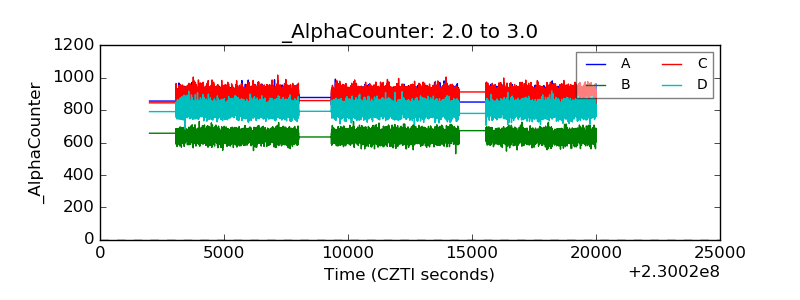 |
| _CPM_Rate | 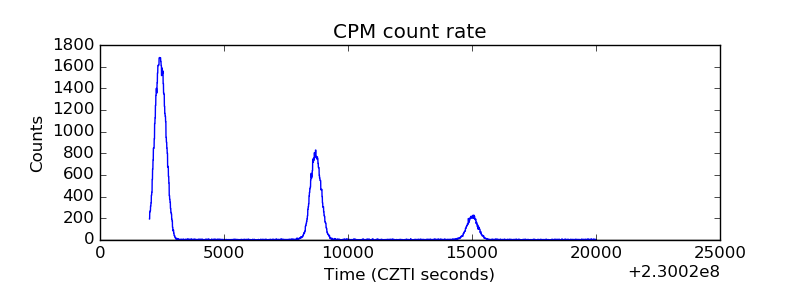 |
| CZT Counter |  |
| +2.5 Volts monitor |  |
| +5 Volts monitor |  |
| _ROLL_ROT |  |
| _Roll_DEC | 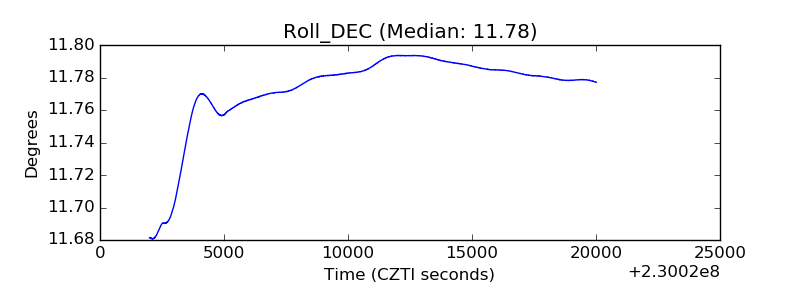 |
| _Roll_RA |  |
| Veto Counter | 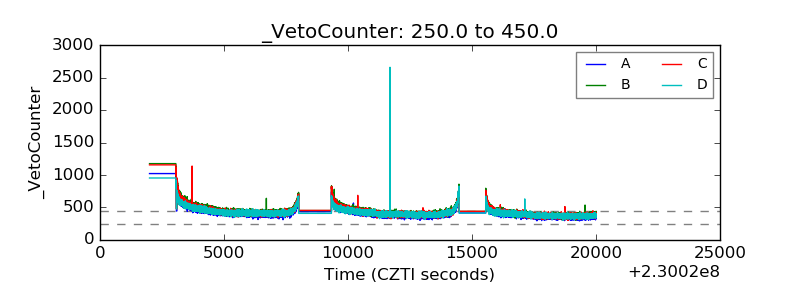 |