| Param | Original file | Final file |
|---|---|---|
| Filename | modeM0/AS1C02_030T01_9000001168cztM0_level2.evt | modeM0/AS1C02_030T01_9000001168cztM0_level2_quad_clean.evt |
| Size (bytes) | 973,635,840 | 288,688,320 |
| Size | 928.5 MB | 275.3 MB |
| Events in quadrant A | 7,000,737 | 1,938,805 |
| Events in quadrant B | 7,373,354 | 1,973,321 |
| Events in quadrant C | 6,679,620 | 1,939,939 |
| Events in quadrant D | 7,416,558 | 1,857,104 |
| Mode M0 | |||
|---|---|---|---|
| Quadrant | BADHDUFLAG | Total packets | Discarded packets |
| A | 0 | 30931 | 0 |
| B | 0 | 31498 | 0 |
| C | 0 | 30482 | 0 |
| D | 0 | 32617 | 0 |
| Mode SS | |||
|---|---|---|---|
| Quadrant | BADHDUFLAG | Total packets | Discarded packets |
| A | 0 | 306 | 0 |
| B | 0 | 306 | 0 |
| C | 0 | 306 | 0 |
| D | 0 | 306 | 0 |
| Mode M9 | |||
|---|---|---|---|
| Quadrant | BADHDUFLAG | Total packets | Discarded packets |
| A | 0 | 36 | 0 |
| B | 0 | 36 | 0 |
| C | 0 | 36 | 0 |
| D | 0 | 36 | 0 |
| Quadrant | Total seconds | Saturated seconds | Saturation percentage |
|---|---|---|---|
| A | 15010 | 97 | 0.646236% |
| B | 15002 | 107 | 0.713238% |
| C | 15011 | 30 | 0.199853% |
| D | 15018 | 112 | 0.745772% |
Noise dominated data is calculated using 1-second bins in cleaned event files. If a bin has >2000 counts, and if more than 50% of those come from <1% of pixels, then it is considered to be noise-dominated and hence unusable.
| Quadrant | # 1 sec bins | Bins with >0 counts | Bins with >2000 counts | High rate bins dominated by noise | Noise dominated (total time) | Noise dominated (detector-on time) | Marked lightcurve |
|---|---|---|---|---|---|---|---|
| A | 18630 | 15033 | 26 | 26 | 0.14% | 0.17% |  |
| B | 18630 | 15031 | 14 | 14 | 0.08% | 0.09% |  |
| C | 18630 | 15029 | 1 | 1 | 0.01% | 0.01% |  |
| D | 18630 | 15033 | 69 | 69 | 0.37% | 0.46% | 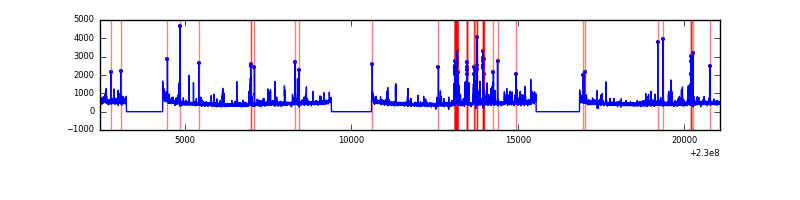 |
Top three noisy pixels from each quadrant. If the there are fewer than three noisy pixels in the level2.evt file, extra rows are filled as -1
| Pixel properties | Quadrant properties | ||||||
|---|---|---|---|---|---|---|---|
| Quadrant | DetID | PixID | Counts | Sigma | Mean | Median | Sigma |
| A | 14 | 111 | 150977 | 423.75 | 1768 | 1736 | 352.2 |
| A | 1 | 162 | 24391 | 64.33 | 1768 | 1736 | 352.2 |
| A | 0 | 226 | 17009 | 43.37 | 1768 | 1736 | 352.2 |
| B | 0 | 214 | 230072 | 701.95 | 1772 | 1729 | 325.3 |
| B | 10 | 16 | 76196 | 228.92 | 1772 | 1729 | 325.3 |
| B | 4 | 81 | 55582 | 165.55 | 1772 | 1729 | 325.3 |
| C | 1 | 16 | 28546 | 69.36 | 1705 | 1711 | 386.9 |
| C | 13 | 61 | 13304 | 29.96 | 1705 | 1711 | 386.9 |
| C | 3 | 202 | 4338 | 6.79 | 1705 | 1711 | 386.9 |
| D | 13 | 122 | 217138 | 532.16 | 1703 | 1652 | 404.9 |
| D | 12 | 233 | 143903 | 351.3 | 1703 | 1652 | 404.9 |
| D | 7 | 71 | 97472 | 236.64 | 1703 | 1652 | 404.9 |
Histogram calculated using DETX and DETY for each event in the final _common_clean file
| Quadrant A |  |
 |
Quadrant B |
|---|---|---|---|
| Quadrant D |  |
 |
Quadrant C |
| Plot type | Count rate plots | Images |
|---|---|---|
| Comparison with Poisson distribution Blue bars denote a histogram of data divided into 1 sec bins. Red curve is a Poisson curve with rate = median count rate of data. |
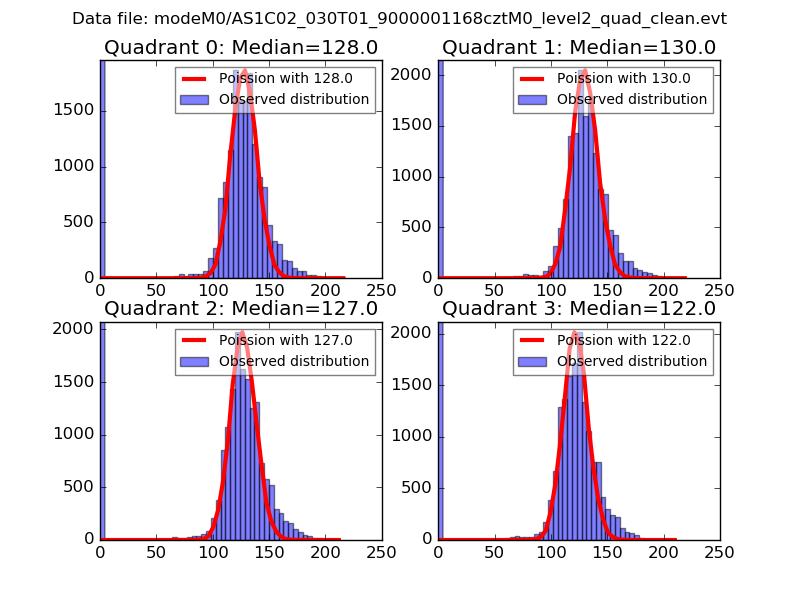 |
 |
| Quadrant-wise count rates Data is divided into 100 sec bins |
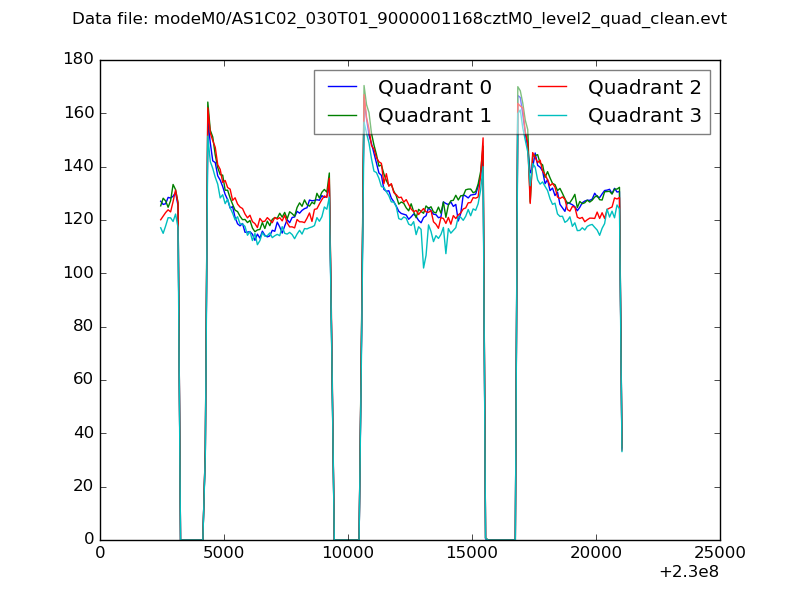 |
|
| Module-wise count rates for Quadrant A Data is divided into 100 sec bins |
 |
 |
| Module-wise count rates for Quadrant B Data is divided into 100 sec bins |
 |
 |
| Module-wise count rates for Quadrant C Data is divided into 100 sec bins |
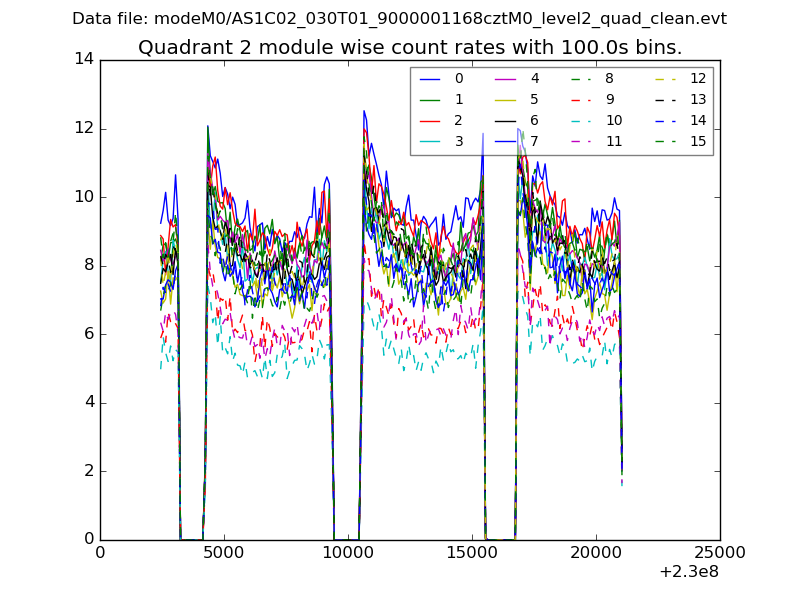 |
 |
| Module-wise count rates for Quadrant D Data is divided into 100 sec bins |
 |
 |
| Parameter | Plot |
|---|---|
| CZT HV Monitor |  |
| D_VDD | 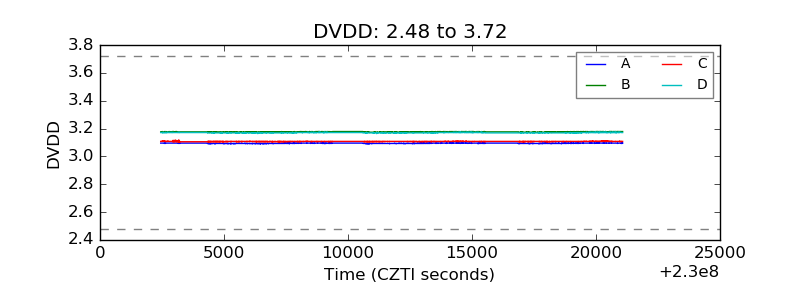 |
| Temperature 1 |  |
| Veto HV Monitor | 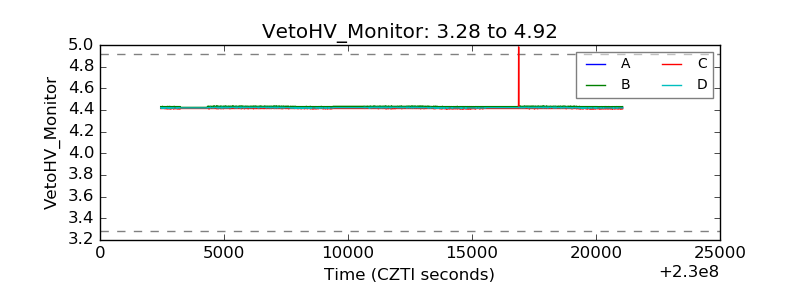 |
| Veto LLD |  |
| Alpha Counter |  |
| _CPM_Rate |  |
| CZT Counter | 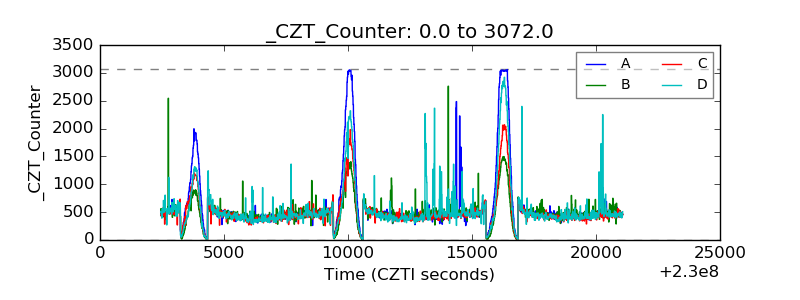 |
| +2.5 Volts monitor |  |
| +5 Volts monitor | 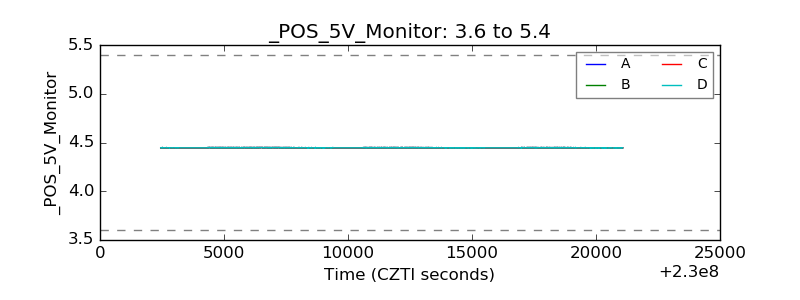 |
| _ROLL_ROT |  |
| _Roll_DEC | 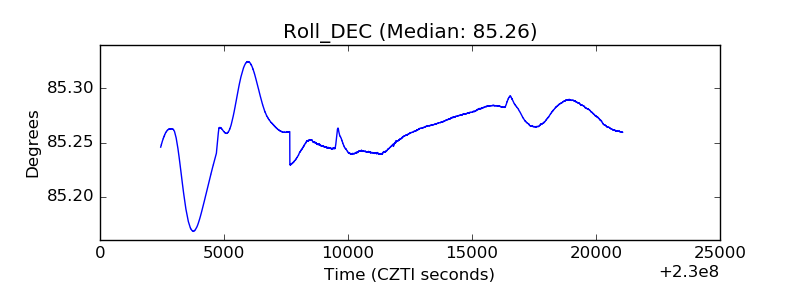 |
| _Roll_RA |  |
| Veto Counter |  |