| Param | Original file | Final file |
|---|---|---|
| Filename | modeM0/AS1A03_062T01_9000001176cztM0_level2.evt | modeM0/AS1A03_062T01_9000001176cztM0_level2_quad_clean.evt |
| Size (bytes) | 2,500,280,640 | 436,668,480 |
| Size | 2.3 GB | 416.4 MB |
| Events in quadrant A | 18,033,794 | 2,703,511 |
| Events in quadrant B | 18,645,149 | 2,754,981 |
| Events in quadrant C | 17,261,066 | 2,671,733 |
| Events in quadrant D | 19,310,211 | 2,582,326 |
| Mode SS | |||
|---|---|---|---|
| Quadrant | BADHDUFLAG | Total packets | Discarded packets |
| A | 0 | 748 | 0 |
| B | 0 | 748 | 0 |
| C | 0 | 748 | 0 |
| D | 0 | 748 | 0 |
| Mode M0 | |||
|---|---|---|---|
| Quadrant | BADHDUFLAG | Total packets | Discarded packets |
| A | 0 | 76505 | 0 |
| B | 0 | 78008 | 0 |
| C | 0 | 75321 | 0 |
| D | 0 | 81962 | 0 |
| Mode M9 | |||
|---|---|---|---|
| Quadrant | BADHDUFLAG | Total packets | Discarded packets |
| A | 0 | 84 | 0 |
| B | 0 | 84 | 0 |
| C | 0 | 84 | 0 |
| D | 0 | 84 | 0 |
| Quadrant | Total seconds | Saturated seconds | Saturation percentage |
|---|---|---|---|
| A | 36595 | 525 | 1.434622% |
| B | 36595 | 467 | 1.276131% |
| C | 36595 | 191 | 0.521929% |
| D | 36595 | 484 | 1.322585% |
Noise dominated data is calculated using 1-second bins in cleaned event files. If a bin has >2000 counts, and if more than 50% of those come from <1% of pixels, then it is considered to be noise-dominated and hence unusable.
| Quadrant | # 1 sec bins | Bins with >0 counts | Bins with >2000 counts | High rate bins dominated by noise | Noise dominated (total time) | Noise dominated (detector-on time) | Marked lightcurve |
|---|---|---|---|---|---|---|---|
| A | 44925 | 36602 | 2 | 2 | 0.00% | 0.01% |  |
| B | 44925 | 36601 | 73 | 73 | 0.16% | 0.20% |  |
| C | 44925 | 36602 | 9 | 9 | 0.02% | 0.02% |  |
| D | 44925 | 36603 | 279 | 279 | 0.62% | 0.76% |  |
Top three noisy pixels from each quadrant. If the there are fewer than three noisy pixels in the level2.evt file, extra rows are filled as -1
| Pixel properties | Quadrant properties | ||||||
|---|---|---|---|---|---|---|---|
| Quadrant | DetID | PixID | Counts | Sigma | Mean | Median | Sigma |
| A | 14 | 111 | 484990 | 527.09 | 4541 | 4451 | 911.7 |
| A | 15 | 236 | 63233 | 64.48 | 4541 | 4451 | 911.7 |
| A | 0 | 226 | 42339 | 41.56 | 4541 | 4451 | 911.7 |
| B | 4 | 48 | 473089 | 548.13 | 4554 | 4453 | 855.0 |
| B | 4 | 81 | 119097 | 134.09 | 4554 | 4453 | 855.0 |
| B | 0 | 214 | 112786 | 126.71 | 4554 | 4453 | 855.0 |
| C | 1 | 16 | 115678 | 110.37 | 4387 | 4413 | 1008.1 |
| C | 9 | 68 | 35926 | 31.26 | 4387 | 4413 | 1008.1 |
| C | 13 | 61 | 33499 | 28.85 | 4387 | 4413 | 1008.1 |
| D | 2 | 136 | 941373 | 901.07 | 4353 | 4251 | 1040.0 |
| D | 2 | 14 | 818750 | 783.17 | 4353 | 4251 | 1040.0 |
| D | 1 | 52 | 317756 | 301.45 | 4353 | 4251 | 1040.0 |
Histogram calculated using DETX and DETY for each event in the final _common_clean file
| Quadrant A |  |
 |
Quadrant B |
|---|---|---|---|
| Quadrant D | 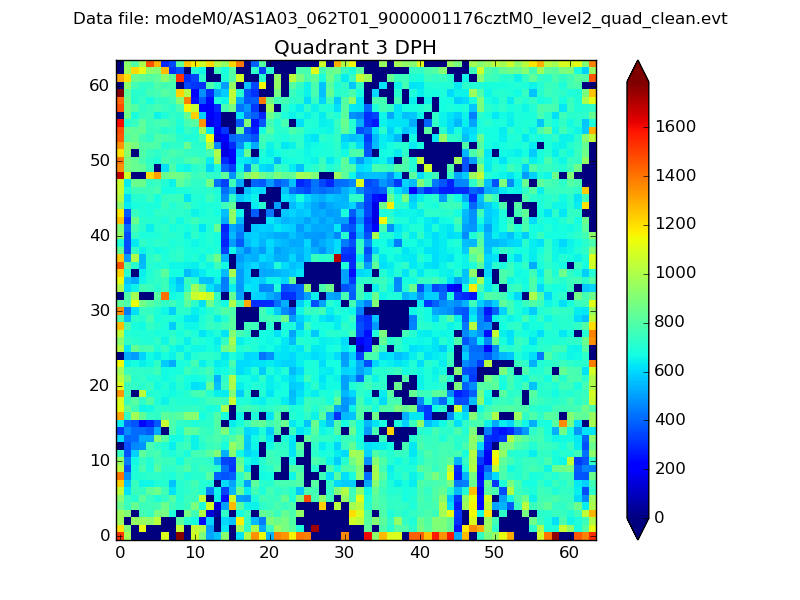 |
 |
Quadrant C |
| Plot type | Count rate plots | Images |
|---|---|---|
| Comparison with Poisson distribution Blue bars denote a histogram of data divided into 1 sec bins. Red curve is a Poisson curve with rate = median count rate of data. |
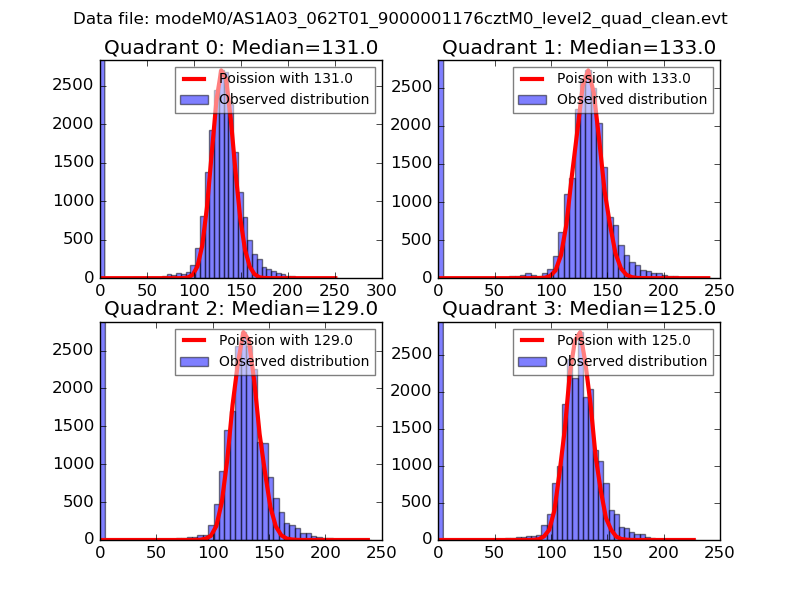 |
 |
| Quadrant-wise count rates Data is divided into 100 sec bins |
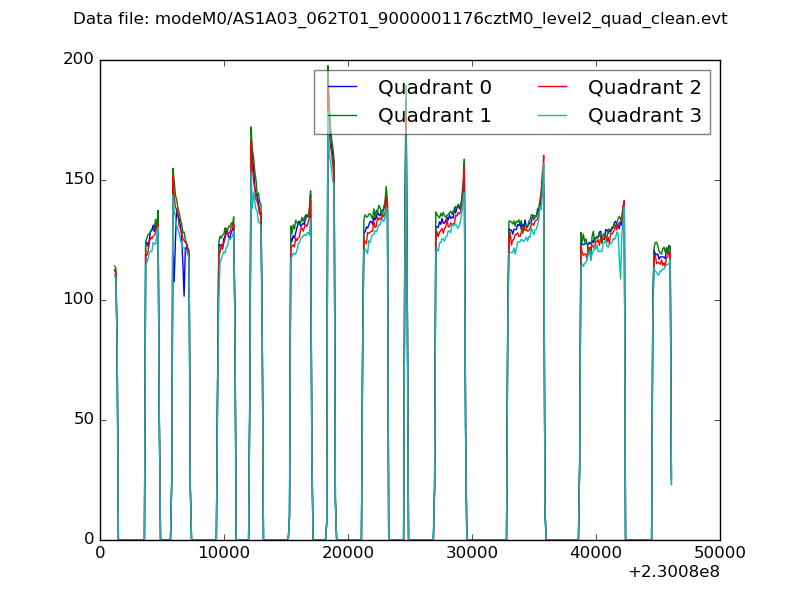 |
|
| Module-wise count rates for Quadrant A Data is divided into 100 sec bins |
 |
 |
| Module-wise count rates for Quadrant B Data is divided into 100 sec bins |
 |
 |
| Module-wise count rates for Quadrant C Data is divided into 100 sec bins |
 |
 |
| Module-wise count rates for Quadrant D Data is divided into 100 sec bins |
 |
 |
| Parameter | Plot |
|---|---|
| CZT HV Monitor |  |
| D_VDD | 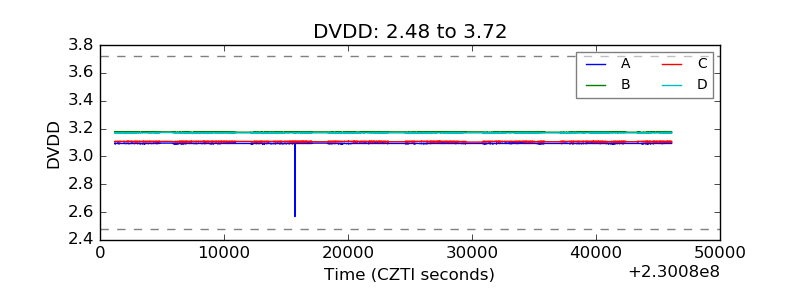 |
| Temperature 1 |  |
| Veto HV Monitor |  |
| Veto LLD |  |
| Alpha Counter |  |
| _CPM_Rate |  |
| CZT Counter |  |
| +2.5 Volts monitor |  |
| +5 Volts monitor |  |
| _ROLL_ROT |  |
| _Roll_DEC |  |
| _Roll_RA |  |
| Veto Counter |  |