| Param | Original file | Final file |
|---|---|---|
| Filename | modeM0/AS1G07_028T01_9000001166cztM0_level2.evt | modeM0/AS1G07_028T01_9000001166cztM0_level2_quad_clean.evt |
| Size (bytes) | 1,172,482,560 | 236,520,000 |
| Size | 1.1 GB | 225.6 MB |
| Events in quadrant A | 7,790,151 | 1,522,940 |
| Events in quadrant B | 10,126,194 | 1,479,245 |
| Events in quadrant C | 7,723,648 | 1,525,805 |
| Events in quadrant D | 8,707,011 | 1,452,047 |
| Mode M0 | |||
|---|---|---|---|
| Quadrant | BADHDUFLAG | Total packets | Discarded packets |
| A | 0 | 34904 | 0 |
| B | 0 | 41695 | 0 |
| C | 0 | 34922 | 0 |
| D | 0 | 37911 | 0 |
| Mode M9 | |||
|---|---|---|---|
| Quadrant | BADHDUFLAG | Total packets | Discarded packets |
| A | 0 | 24 | 0 |
| B | 0 | 24 | 0 |
| C | 0 | 24 | 0 |
| D | 0 | 24 | 0 |
| Mode SS | |||
|---|---|---|---|
| Quadrant | BADHDUFLAG | Total packets | Discarded packets |
| A | 0 | 350 | 0 |
| B | 0 | 350 | 0 |
| C | 0 | 350 | 0 |
| D | 0 | 350 | 0 |
| Quadrant | Total seconds | Saturated seconds | Saturation percentage |
|---|---|---|---|
| A | 17168 | 52 | 0.302889% |
| B | 17167 | 722 | 4.205744% |
| C | 17169 | 40 | 0.232978% |
| D | 17168 | 216 | 1.258155% |
Noise dominated data is calculated using 1-second bins in cleaned event files. If a bin has >2000 counts, and if more than 50% of those come from <1% of pixels, then it is considered to be noise-dominated and hence unusable.
| Quadrant | # 1 sec bins | Bins with >0 counts | Bins with >2000 counts | High rate bins dominated by noise | Noise dominated (total time) | Noise dominated (detector-on time) | Marked lightcurve |
|---|---|---|---|---|---|---|---|
| A | 19577 | 17175 | 0 | 0 | 0.00% | 0.00% |  |
| B | 19577 | 17175 | 538 | 538 | 2.75% | 3.13% |  |
| C | 19577 | 17175 | 5 | 5 | 0.03% | 0.03% |  |
| D | 19577 | 17175 | 143 | 143 | 0.73% | 0.83% |  |
Top three noisy pixels from each quadrant. If the there are fewer than three noisy pixels in the level2.evt file, extra rows are filled as -1
| Pixel properties | Quadrant properties | ||||||
|---|---|---|---|---|---|---|---|
| Quadrant | DetID | PixID | Counts | Sigma | Mean | Median | Sigma |
| A | 0 | 226 | 18794 | 41.07 | 2017 | 1977 | 409.5 |
| A | 12 | 194 | 17805 | 38.66 | 2017 | 1977 | 409.5 |
| A | 15 | 236 | 11353 | 22.9 | 2017 | 1977 | 409.5 |
| B | 10 | 16 | 1733243 | 4573.19 | 1983 | 1937 | 378.6 |
| B | 0 | 214 | 253866 | 665.46 | 1983 | 1937 | 378.6 |
| B | 4 | 81 | 241589 | 633.03 | 1983 | 1937 | 378.6 |
| C | 1 | 16 | 82515 | 177.9 | 1958 | 1969 | 452.8 |
| C | 13 | 61 | 14937 | 28.64 | 1958 | 1969 | 452.8 |
| C | 8 | 208 | 7146 | 11.43 | 1958 | 1969 | 452.8 |
| D | 11 | 144 | 459917 | 891.56 | 1931 | 1896 | 513.7 |
| D | 8 | 195 | 206795 | 398.85 | 1931 | 1896 | 513.7 |
| D | 13 | 169 | 147172 | 282.79 | 1931 | 1896 | 513.7 |
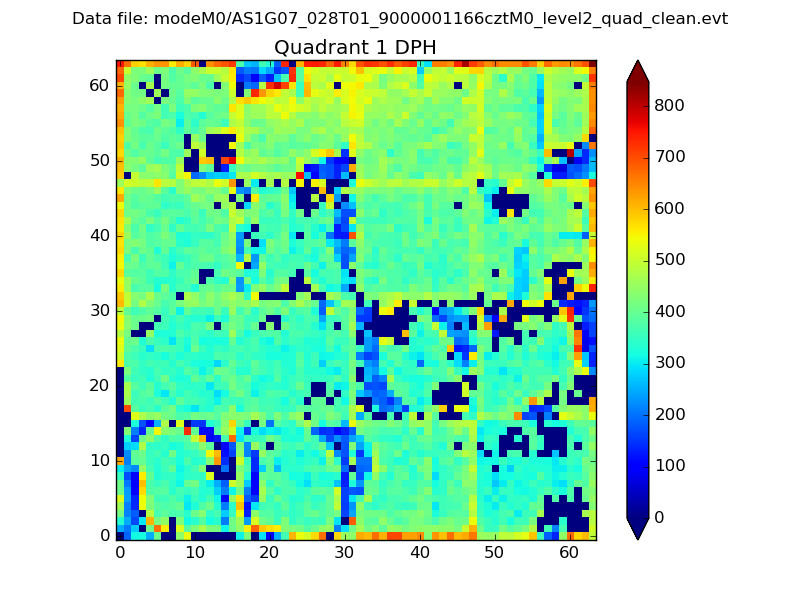
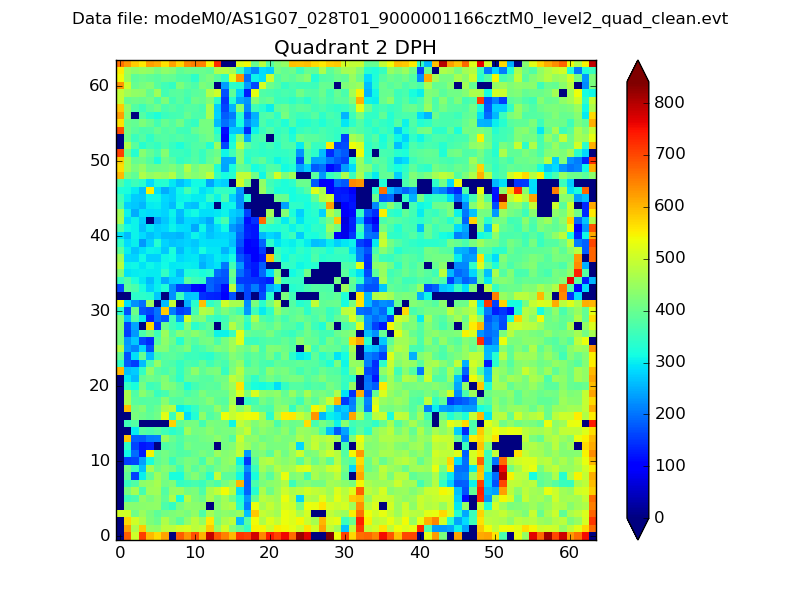
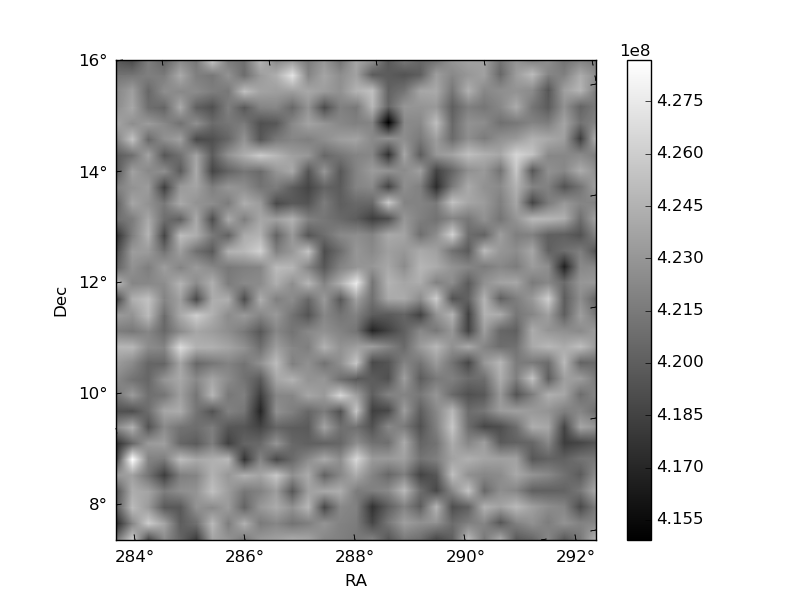
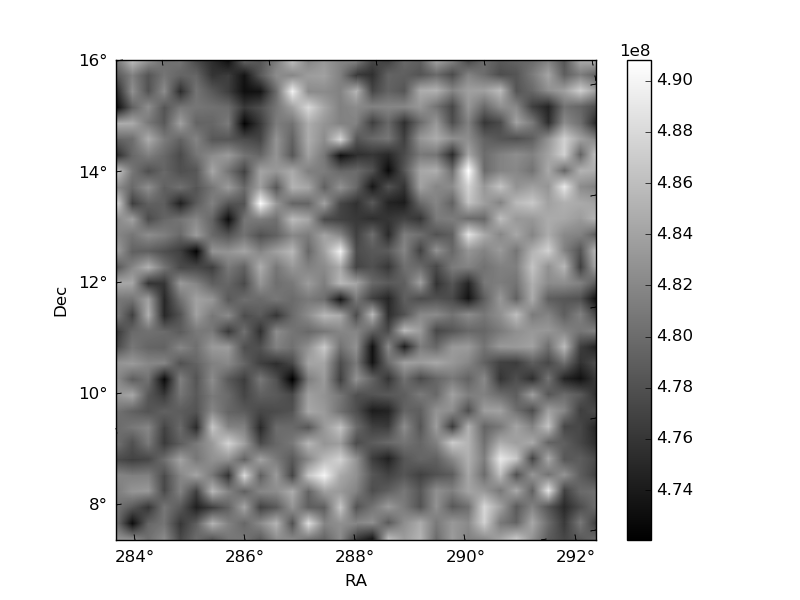
Histogram calculated using DETX and DETY for each event in the final _common_clean file
| Quadrant A |  |
 |
Quadrant B |
|---|---|---|---|
| Quadrant D |  |
 |
Quadrant C |
| Plot type | Count rate plots | Images |
|---|---|---|
| Comparison with Poisson distribution Blue bars denote a histogram of data divided into 1 sec bins. Red curve is a Poisson curve with rate = median count rate of data. |
 |
 |
| Quadrant-wise count rates Data is divided into 100 sec bins |
 |
|
| Module-wise count rates for Quadrant A Data is divided into 100 sec bins |
 |
 |
| Module-wise count rates for Quadrant B Data is divided into 100 sec bins |
 |
 |
| Module-wise count rates for Quadrant C Data is divided into 100 sec bins |
 |
 |
| Module-wise count rates for Quadrant D Data is divided into 100 sec bins |
 |
 |
| Parameter | Plot |
|---|---|
| CZT HV Monitor |  |
| D_VDD |  |
| Temperature 1 |  |
| Veto HV Monitor | 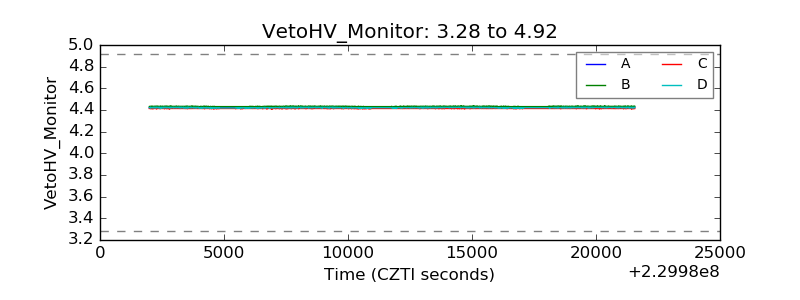 |
| Veto LLD |  |
| Alpha Counter |  |
| _CPM_Rate |  |
| CZT Counter |  |
| +2.5 Volts monitor | 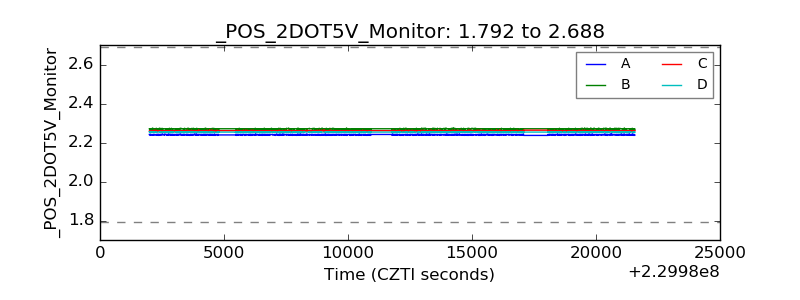 |
| +5 Volts monitor |  |
| _ROLL_ROT |  |
| _Roll_DEC | 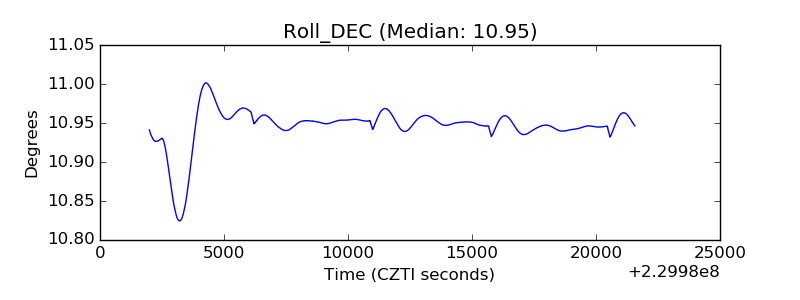 |
| _Roll_RA |  |
| Veto Counter |  |