| Param | Original file | Final file |
|---|---|---|
| Filename | modeM0/AS1A03_036T01_9000001164cztM0_level2.evt | modeM0/AS1A03_036T01_9000001164cztM0_level2_quad_clean.evt |
| Size (bytes) | 4,089,631,680 | 789,560,640 |
| Size | 3.8 GB | 753.0 MB |
| Events in quadrant A | 30,847,739 | 5,014,266 |
| Events in quadrant B | 28,709,067 | 5,196,610 |
| Events in quadrant C | 26,493,534 | 5,011,462 |
| Events in quadrant D | 33,955,697 | 4,779,870 |
| Mode M0 | |||
|---|---|---|---|
| Quadrant | BADHDUFLAG | Total packets | Discarded packets |
| A | 0 | 130064 | 0 |
| B | 0 | 122137 | 0 |
| C | 0 | 118261 | 0 |
| D | 0 | 139549 | 0 |
| Mode M9 | |||
|---|---|---|---|
| Quadrant | BADHDUFLAG | Total packets | Discarded packets |
| A | 0 | 90 | 0 |
| B | 0 | 90 | 0 |
| C | 0 | 90 | 0 |
| D | 0 | 90 | 0 |
| Mode SS | |||
|---|---|---|---|
| Quadrant | BADHDUFLAG | Total packets | Discarded packets |
| A | 0 | 1164 | 0 |
| B | 0 | 1162 | 0 |
| C | 0 | 1164 | 0 |
| D | 0 | 1164 | 0 |
| Quadrant | Total seconds | Saturated seconds | Saturation percentage |
|---|---|---|---|
| A | 57038 | 2395 | 4.198955% |
| B | 57038 | 994 | 1.742698% |
| C | 57039 | 587 | 1.029120% |
| D | 57035 | 2181 | 3.823968% |
Noise dominated data is calculated using 1-second bins in cleaned event files. If a bin has >2000 counts, and if more than 50% of those come from <1% of pixels, then it is considered to be noise-dominated and hence unusable.
| Quadrant | # 1 sec bins | Bins with >0 counts | Bins with >2000 counts | High rate bins dominated by noise | Noise dominated (total time) | Noise dominated (detector-on time) | Marked lightcurve |
|---|---|---|---|---|---|---|---|
| A | 66168 | 57053 | 1180 | 1180 | 1.78% | 2.07% |  |
| B | 66168 | 57055 | 71 | 71 | 0.11% | 0.12% | 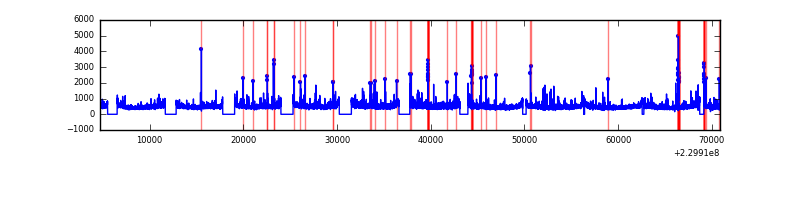 |
| C | 66168 | 57055 | 39 | 39 | 0.06% | 0.07% | 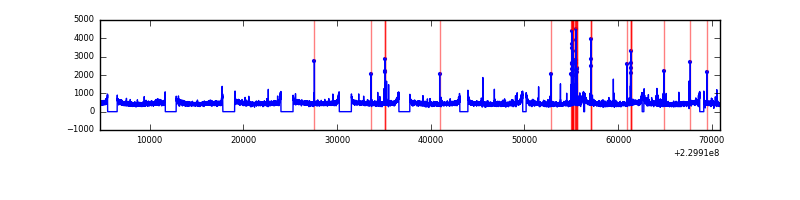 |
| D | 66168 | 57054 | 1347 | 1347 | 2.04% | 2.36% |  |
Top three noisy pixels from each quadrant. If the there are fewer than three noisy pixels in the level2.evt file, extra rows are filled as -1
| Pixel properties | Quadrant properties | ||||||
|---|---|---|---|---|---|---|---|
| Quadrant | DetID | PixID | Counts | Sigma | Mean | Median | Sigma |
| A | 15 | 236 | 2047596 | 1495.32 | 6804 | 6665 | 1364.9 |
| A | 15 | 239 | 1666148 | 1215.85 | 6804 | 6665 | 1364.9 |
| A | 14 | 111 | 845956 | 614.92 | 6804 | 6665 | 1364.9 |
| B | 0 | 214 | 623651 | 478.33 | 6930 | 6773 | 1289.7 |
| B | 4 | 81 | 256401 | 193.56 | 6930 | 6773 | 1289.7 |
| B | 4 | 173 | 238699 | 179.84 | 6930 | 6773 | 1289.7 |
| C | 1 | 16 | 408847 | 262.19 | 6685 | 6710 | 1533.8 |
| C | 13 | 61 | 51297 | 29.07 | 6685 | 6710 | 1533.8 |
| C | 12 | 4 | 25454 | 12.22 | 6685 | 6710 | 1533.8 |
| D | 12 | 233 | 5199855 | 3006.7 | 6591 | 6450 | 1727.3 |
| D | 2 | 152 | 928518 | 533.83 | 6591 | 6450 | 1727.3 |
| D | 7 | 71 | 793636 | 455.74 | 6591 | 6450 | 1727.3 |
Histogram calculated using DETX and DETY for each event in the final _common_clean file
| Quadrant A | 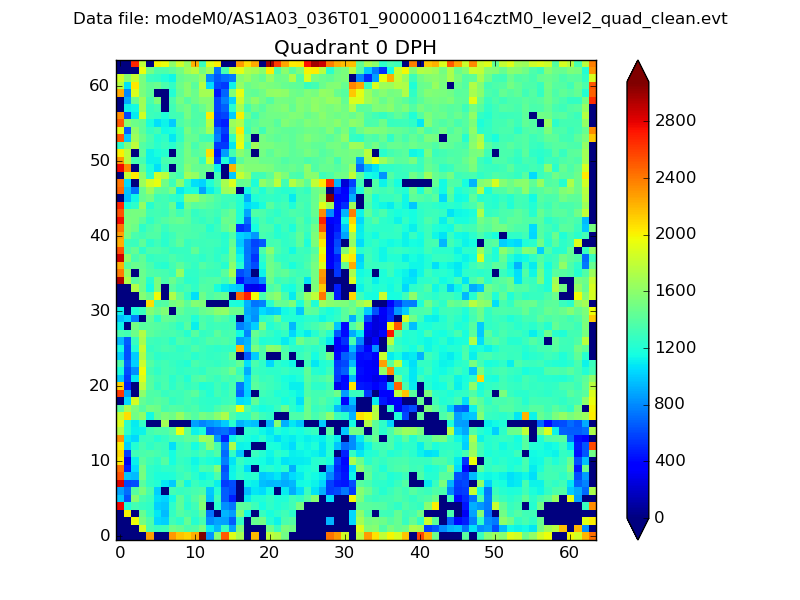 |
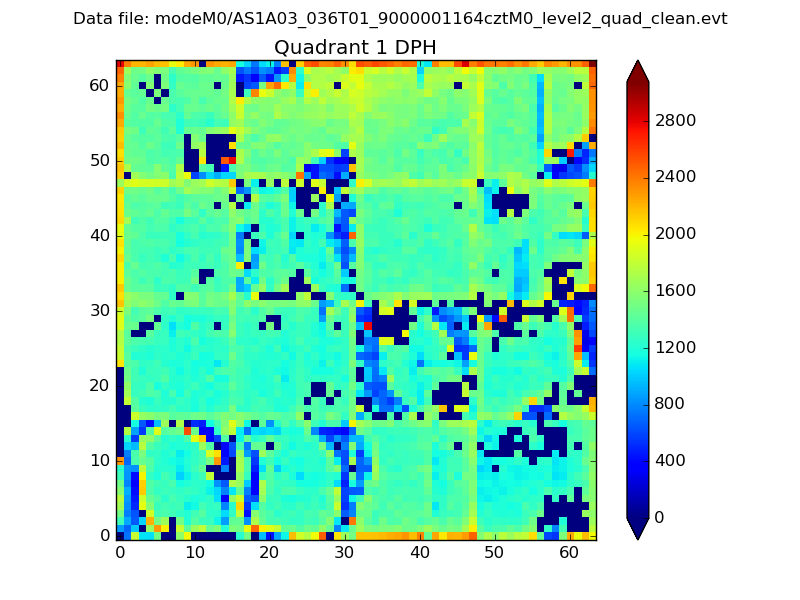 |
Quadrant B |
|---|---|---|---|
| Quadrant D | 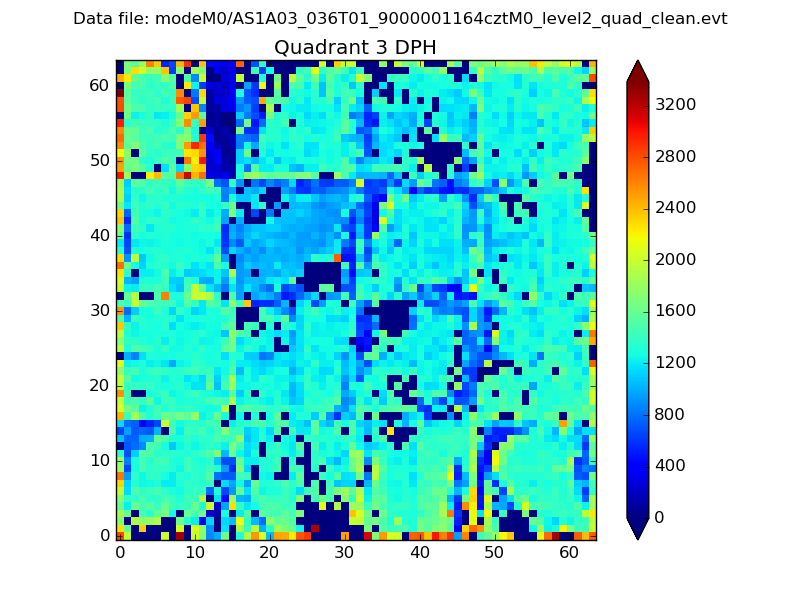 |
 |
Quadrant C |
| Plot type | Count rate plots | Images |
|---|---|---|
| Comparison with Poisson distribution Blue bars denote a histogram of data divided into 1 sec bins. Red curve is a Poisson curve with rate = median count rate of data. |
 |
 |
| Quadrant-wise count rates Data is divided into 100 sec bins |
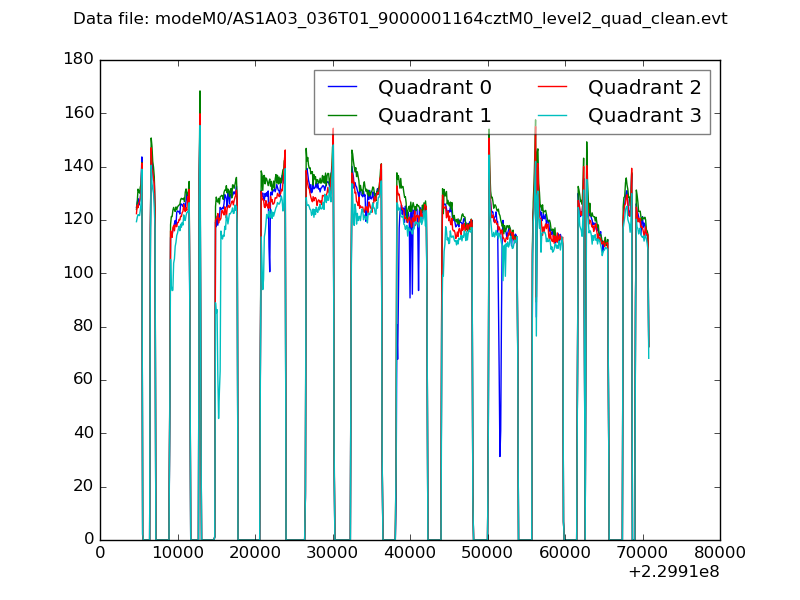 |
|
| Module-wise count rates for Quadrant A Data is divided into 100 sec bins |
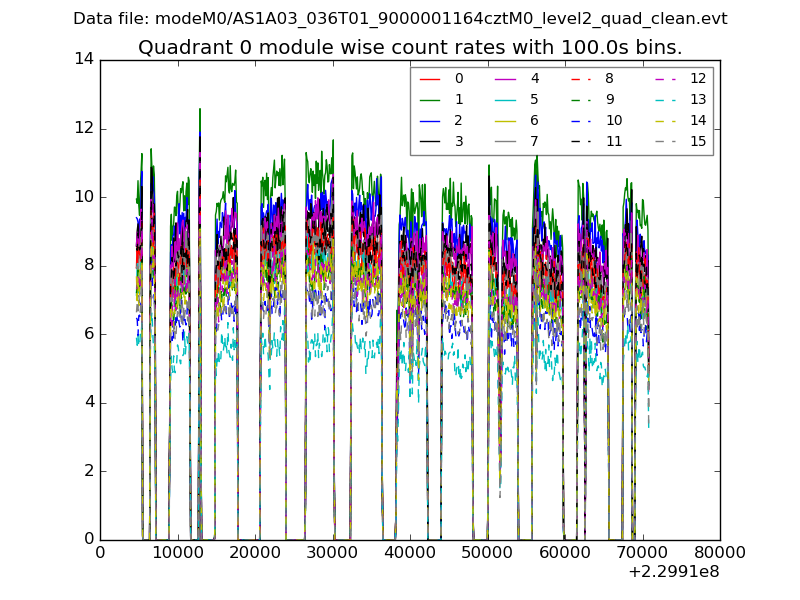 |
 |
| Module-wise count rates for Quadrant B Data is divided into 100 sec bins |
 |
 |
| Module-wise count rates for Quadrant C Data is divided into 100 sec bins |
 |
 |
| Module-wise count rates for Quadrant D Data is divided into 100 sec bins |
 |
 |
| Parameter | Plot |
|---|---|
| CZT HV Monitor |  |
| D_VDD | 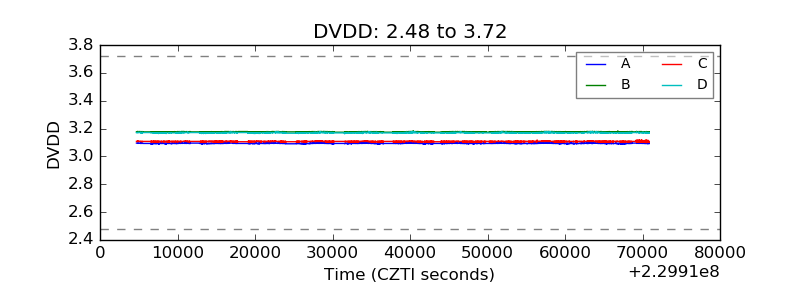 |
| Temperature 1 |  |
| Veto HV Monitor |  |
| Veto LLD |  |
| Alpha Counter | 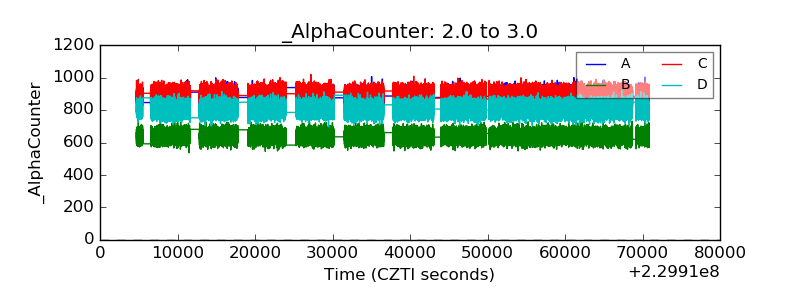 |
| _CPM_Rate |  |
| CZT Counter |  |
| +2.5 Volts monitor |  |
| +5 Volts monitor | 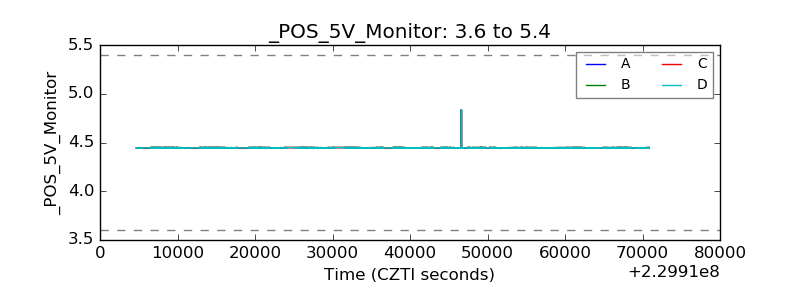 |
| _ROLL_ROT |  |
| _Roll_DEC |  |
| _Roll_RA | 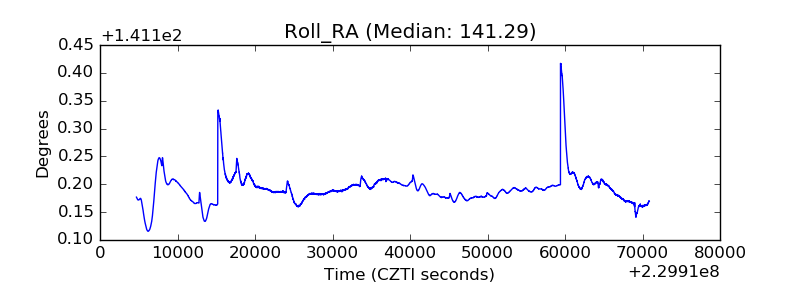 |
| Veto Counter |  |