| Param | Original file | Final file |
|---|---|---|
| Filename | modeM0/AS1G07_046T01_9000001162cztM0_level2.evt | modeM0/AS1G07_046T01_9000001162cztM0_level2_quad_clean.evt |
| Size (bytes) | 2,453,486,400 | 469,471,680 |
| Size | 2.3 GB | 447.7 MB |
| Events in quadrant A | 18,687,993 | 2,950,658 |
| Events in quadrant B | 17,794,124 | 2,983,862 |
| Events in quadrant C | 16,024,297 | 2,993,932 |
| Events in quadrant D | 19,416,643 | 2,869,576 |
| Mode M0 | |||
|---|---|---|---|
| Quadrant | BADHDUFLAG | Total packets | Discarded packets |
| A | 0 | 79100 | 0 |
| B | 0 | 76466 | 0 |
| C | 0 | 72180 | 0 |
| D | 0 | 82363 | 0 |
| Mode SS | |||
|---|---|---|---|
| Quadrant | BADHDUFLAG | Total packets | Discarded packets |
| A | 0 | 716 | 0 |
| B | 0 | 716 | 0 |
| C | 0 | 716 | 0 |
| D | 0 | 716 | 0 |
| Mode M9 | |||
|---|---|---|---|
| Quadrant | BADHDUFLAG | Total packets | Discarded packets |
| A | 0 | 28 | 0 |
| B | 0 | 28 | 0 |
| C | 0 | 28 | 0 |
| D | 0 | 28 | 0 |
| Quadrant | Total seconds | Saturated seconds | Saturation percentage |
|---|---|---|---|
| A | 35263 | 1029 | 2.918073% |
| B | 35264 | 608 | 1.724138% |
| C | 35264 | 352 | 0.998185% |
| D | 35266 | 761 | 2.157886% |
Noise dominated data is calculated using 1-second bins in cleaned event files. If a bin has >2000 counts, and if more than 50% of those come from <1% of pixels, then it is considered to be noise-dominated and hence unusable.
| Quadrant | # 1 sec bins | Bins with >0 counts | Bins with >2000 counts | High rate bins dominated by noise | Noise dominated (total time) | Noise dominated (detector-on time) | Marked lightcurve |
|---|---|---|---|---|---|---|---|
| A | 38056 | 35274 | 444 | 444 | 1.17% | 1.26% |  |
| B | 38056 | 35274 | 80 | 80 | 0.21% | 0.23% |  |
| C | 38056 | 35274 | 0 | 0 | 0.00% | 0.00% |  |
| D | 38056 | 35274 | 271 | 271 | 0.71% | 0.77% | 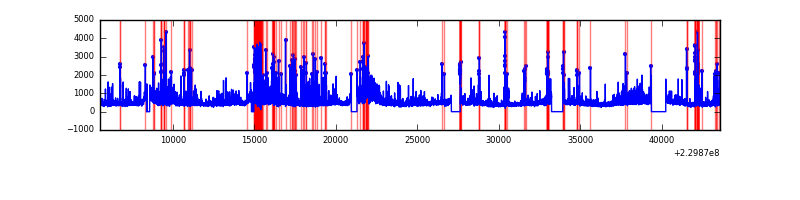 |
Top three noisy pixels from each quadrant. If the there are fewer than three noisy pixels in the level2.evt file, extra rows are filled as -1
| Pixel properties | Quadrant properties | ||||||
|---|---|---|---|---|---|---|---|
| Quadrant | DetID | PixID | Counts | Sigma | Mean | Median | Sigma |
| A | 15 | 236 | 1259903 | 1476.73 | 4175 | 4095 | 850.4 |
| A | 15 | 239 | 764836 | 894.57 | 4175 | 4095 | 850.4 |
| A | 14 | 111 | 466966 | 544.3 | 4175 | 4095 | 850.4 |
| B | 0 | 214 | 379935 | 466.88 | 4214 | 4116 | 805.0 |
| B | 4 | 173 | 359386 | 441.35 | 4214 | 4116 | 805.0 |
| B | 10 | 16 | 220753 | 269.13 | 4214 | 4116 | 805.0 |
| C | 13 | 61 | 31498 | 28.8 | 4098 | 4114 | 951.0 |
| C | 8 | 128 | 23412 | 20.29 | 4098 | 4114 | 951.0 |
| C | 8 | 208 | 13804 | 10.19 | 4098 | 4114 | 951.0 |
| D | 2 | 152 | 950090 | 891.05 | 4047 | 3960 | 1061.8 |
| D | 9 | 102 | 807855 | 757.1 | 4047 | 3960 | 1061.8 |
| D | 1 | 52 | 671185 | 628.38 | 4047 | 3960 | 1061.8 |
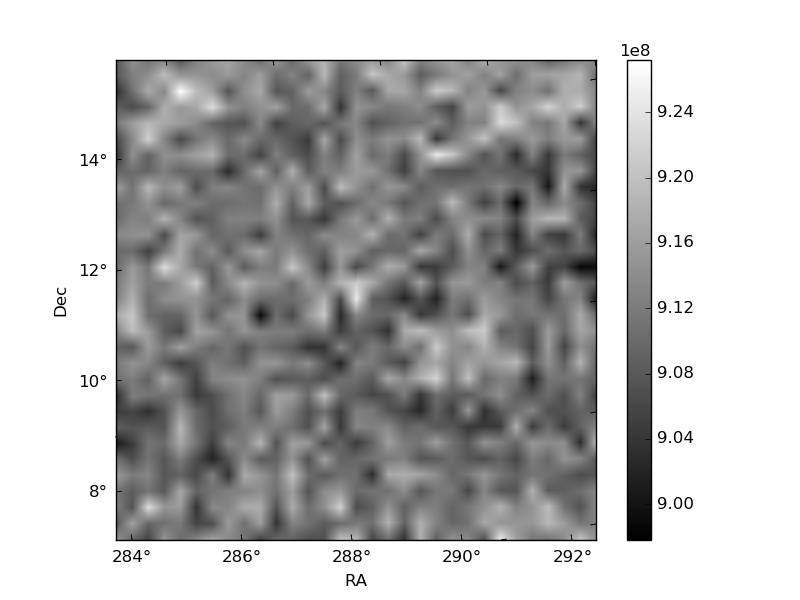
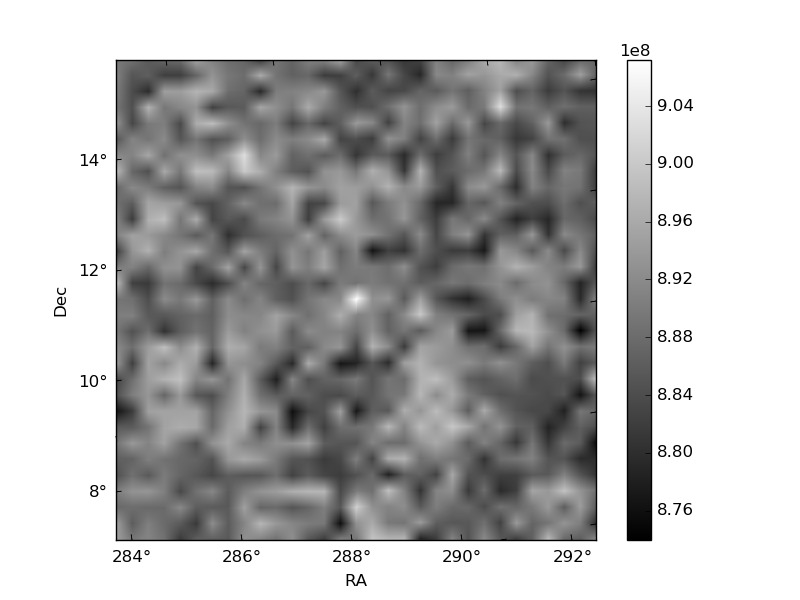
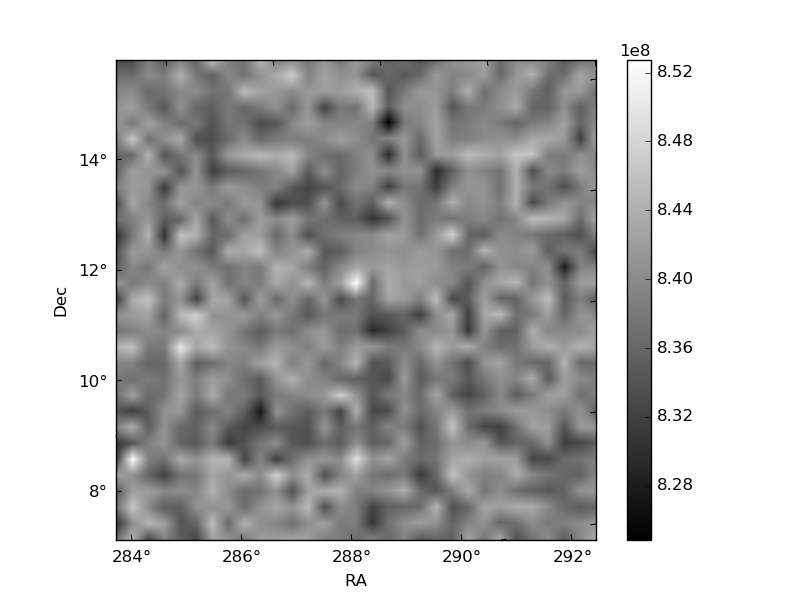
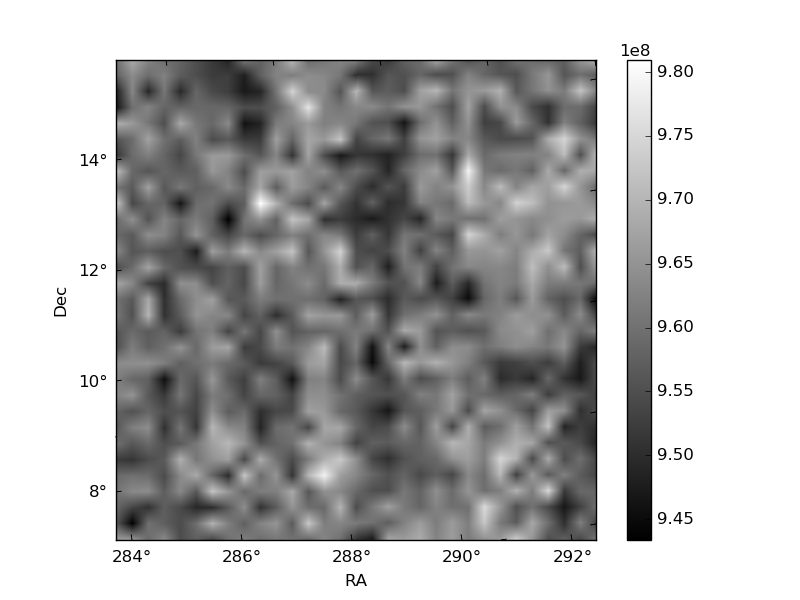
Histogram calculated using DETX and DETY for each event in the final _common_clean file
| Quadrant A |  |
 |
Quadrant B |
|---|---|---|---|
| Quadrant D |  |
 |
Quadrant C |
| Plot type | Count rate plots | Images |
|---|---|---|
| Comparison with Poisson distribution Blue bars denote a histogram of data divided into 1 sec bins. Red curve is a Poisson curve with rate = median count rate of data. |
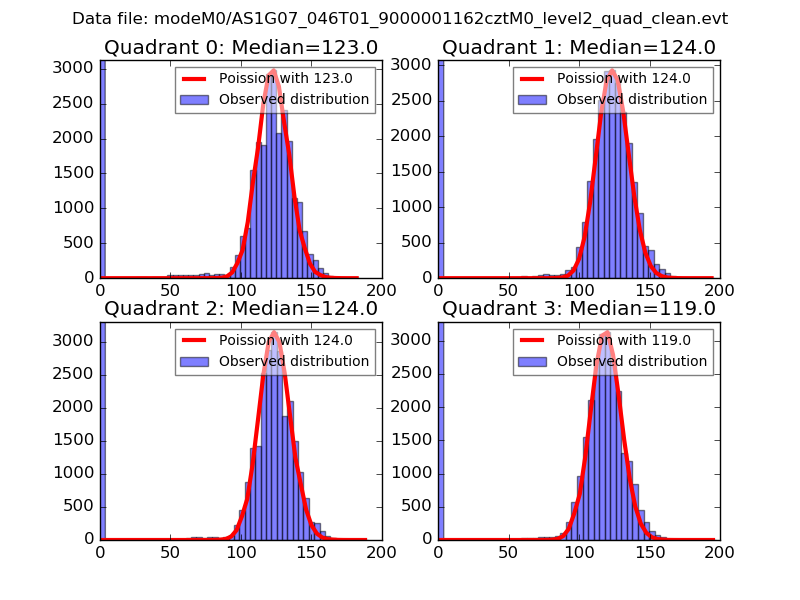 |
 |
| Quadrant-wise count rates Data is divided into 100 sec bins |
 |
|
| Module-wise count rates for Quadrant A Data is divided into 100 sec bins |
 |
 |
| Module-wise count rates for Quadrant B Data is divided into 100 sec bins |
 |
 |
| Module-wise count rates for Quadrant C Data is divided into 100 sec bins |
 |
 |
| Module-wise count rates for Quadrant D Data is divided into 100 sec bins |
 |
 |
| Parameter | Plot |
|---|---|
| CZT HV Monitor |  |
| D_VDD |  |
| Temperature 1 |  |
| Veto HV Monitor |  |
| Veto LLD |  |
| Alpha Counter |  |
| _CPM_Rate |  |
| CZT Counter |  |
| +2.5 Volts monitor |  |
| +5 Volts monitor |  |
| _ROLL_ROT |  |
| _Roll_DEC |  |
| _Roll_RA | 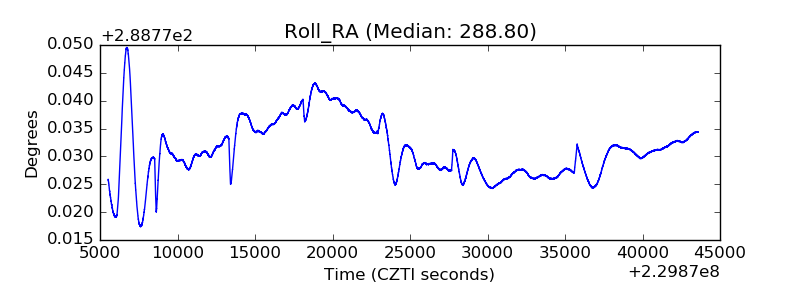 |
| Veto Counter |  |