| Param | Original file | Final file |
|---|---|---|
| Filename | modeM0/AS1G07_080T03_9000001154cztM0_level2.evt | modeM0/AS1G07_080T03_9000001154cztM0_level2_quad_clean.evt |
| Size (bytes) | 2,516,417,280 | 541,310,400 |
| Size | 2.3 GB | 516.2 MB |
| Events in quadrant A | 18,845,314 | 3,510,658 |
| Events in quadrant B | 18,521,530 | 3,548,043 |
| Events in quadrant C | 17,128,940 | 3,439,665 |
| Events in quadrant D | 19,178,570 | 3,320,540 |
| Mode SS | |||
|---|---|---|---|
| Quadrant | BADHDUFLAG | Total packets | Discarded packets |
| A | 0 | 764 | 0 |
| B | 0 | 764 | 0 |
| C | 0 | 764 | 0 |
| D | 0 | 764 | 0 |
| Mode M0 | |||
|---|---|---|---|
| Quadrant | BADHDUFLAG | Total packets | Discarded packets |
| A | 0 | 80326 | 0 |
| B | 0 | 78880 | 0 |
| C | 0 | 76882 | 0 |
| D | 0 | 83119 | 0 |
| Mode M9 | |||
|---|---|---|---|
| Quadrant | BADHDUFLAG | Total packets | Discarded packets |
| A | 0 | 80 | 0 |
| B | 0 | 80 | 0 |
| C | 0 | 80 | 0 |
| D | 0 | 80 | 0 |
| Quadrant | Total seconds | Saturated seconds | Saturation percentage |
|---|---|---|---|
| A | 37536 | 742 | 1.976769% |
| B | 37536 | 534 | 1.422634% |
| C | 37535 | 360 | 0.959105% |
| D | 37536 | 730 | 1.944800% |
Noise dominated data is calculated using 1-second bins in cleaned event files. If a bin has >2000 counts, and if more than 50% of those come from <1% of pixels, then it is considered to be noise-dominated and hence unusable.
| Quadrant | # 1 sec bins | Bins with >0 counts | Bins with >2000 counts | High rate bins dominated by noise | Noise dominated (total time) | Noise dominated (detector-on time) | Marked lightcurve |
|---|---|---|---|---|---|---|---|
| A | 45476 | 37539 | 191 | 191 | 0.42% | 0.51% |  |
| B | 45476 | 37538 | 11 | 11 | 0.02% | 0.03% |  |
| C | 45476 | 37540 | 7 | 7 | 0.02% | 0.02% |  |
| D | 45476 | 37540 | 344 | 344 | 0.76% | 0.92% |  |
Top three noisy pixels from each quadrant. If the there are fewer than three noisy pixels in the level2.evt file, extra rows are filled as -1
| Pixel properties | Quadrant properties | ||||||
|---|---|---|---|---|---|---|---|
| Quadrant | DetID | PixID | Counts | Sigma | Mean | Median | Sigma |
| A | 0 | 23 | 964107 | 1065.71 | 4527 | 4434 | 900.5 |
| A | 15 | 234 | 205510 | 223.29 | 4527 | 4434 | 900.5 |
| A | 0 | 226 | 108850 | 115.95 | 4527 | 4434 | 900.5 |
| B | 0 | 214 | 496195 | 585.03 | 4528 | 4431 | 840.6 |
| B | 4 | 81 | 185323 | 215.2 | 4528 | 4431 | 840.6 |
| B | 0 | 229 | 98146 | 111.49 | 4528 | 4431 | 840.6 |
| C | 9 | 54 | 73492 | 69.36 | 4366 | 4383 | 996.3 |
| C | 10 | 9 | 42992 | 38.75 | 4366 | 4383 | 996.3 |
| C | 13 | 61 | 33499 | 29.22 | 4366 | 4383 | 996.3 |
| D | 6 | 225 | 735916 | 637.8 | 4345 | 4257 | 1147.2 |
| D | 2 | 14 | 662291 | 573.62 | 4345 | 4257 | 1147.2 |
| D | 1 | 52 | 400939 | 345.79 | 4345 | 4257 | 1147.2 |
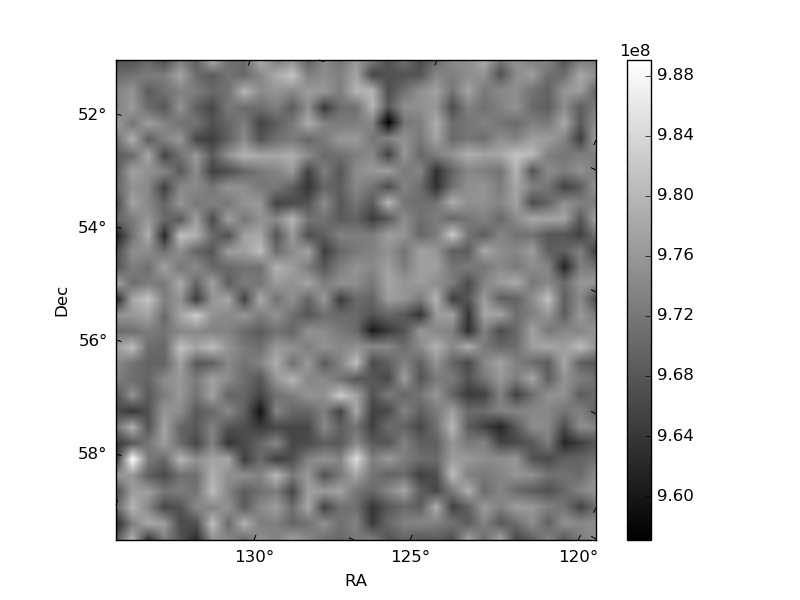
Histogram calculated using DETX and DETY for each event in the final _common_clean file
| Quadrant A |  |
 |
Quadrant B |
|---|---|---|---|
| Quadrant D |  |
 |
Quadrant C |
| Plot type | Count rate plots | Images |
|---|---|---|
| Comparison with Poisson distribution Blue bars denote a histogram of data divided into 1 sec bins. Red curve is a Poisson curve with rate = median count rate of data. |
 |
 |
| Quadrant-wise count rates Data is divided into 100 sec bins |
 |
|
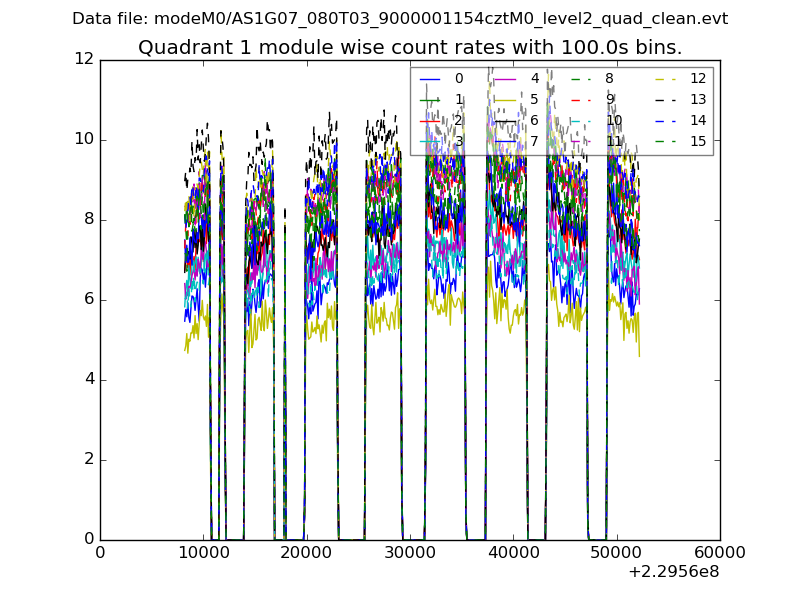
| Module-wise count rates for Quadrant A Data is divided into 100 sec bins |
 |
 |
| Module-wise count rates for Quadrant B Data is divided into 100 sec bins |
 |
 |
| Module-wise count rates for Quadrant C Data is divided into 100 sec bins |
 |
 |
| Module-wise count rates for Quadrant D Data is divided into 100 sec bins |
 |
 |
| Parameter | Plot |
|---|---|
| CZT HV Monitor |  |
| D_VDD |  |
| Temperature 1 | 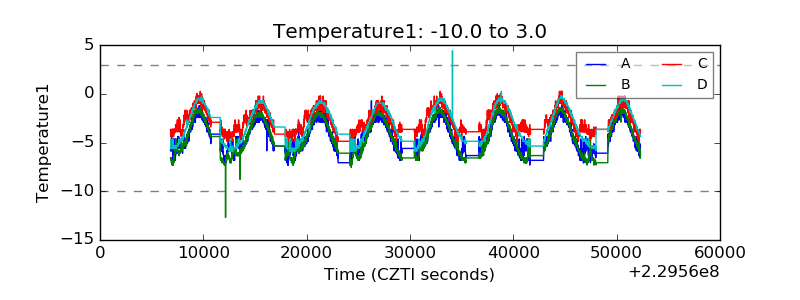 |
| Veto HV Monitor | 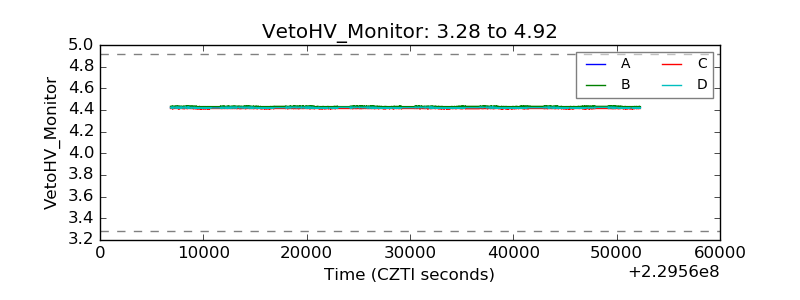 |
| Veto LLD |  |
| Alpha Counter |  |
| _CPM_Rate |  |
| CZT Counter |  |
| +2.5 Volts monitor |  |
| +5 Volts monitor | 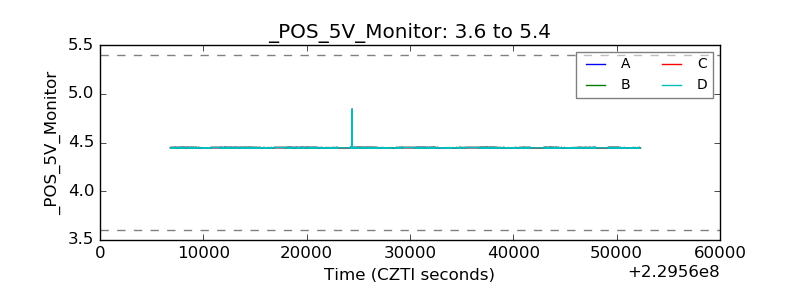 |
| _ROLL_ROT |  |
| _Roll_DEC |  |
| _Roll_RA |  |
| Veto Counter |  |