| Param | Original file | Final file |
|---|---|---|
| Filename | modeM0/AS1A03_093T01_9000001156cztM0_level2.evt | modeM0/AS1A03_093T01_9000001156cztM0_level2_quad_clean.evt |
| Size (bytes) | 5,958,144,000 | 954,290,880 |
| Size | 5.5 GB | 910.1 MB |
| Events in quadrant A | 59,339,036 | 5,384,562 |
| Events in quadrant B | 40,136,445 | 6,161,439 |
| Events in quadrant C | 37,193,493 | 6,034,654 |
| Events in quadrant D | 38,394,636 | 5,853,328 |
| Mode SS | |||
|---|---|---|---|
| Quadrant | BADHDUFLAG | Total packets | Discarded packets |
| A | 0 | 1624 | 0 |
| B | 0 | 1624 | 0 |
| C | 0 | 1624 | 0 |
| D | 0 | 1624 | 0 |
| Mode M9 | |||
|---|---|---|---|
| Quadrant | BADHDUFLAG | Total packets | Discarded packets |
| A | 0 | 124 | 0 |
| B | 0 | 124 | 0 |
| C | 0 | 124 | 0 |
| D | 0 | 124 | 0 |
| Mode M0 | |||
|---|---|---|---|
| Quadrant | BADHDUFLAG | Total packets | Discarded packets |
| A | 0 | 228568 | 0 |
| B | 0 | 170304 | 0 |
| C | 0 | 165650 | 0 |
| D | 0 | 169869 | 0 |
| Quadrant | Total seconds | Saturated seconds | Saturation percentage |
|---|---|---|---|
| A | 79746 | 9872 | 12.379304% |
| B | 79748 | 1293 | 1.621357% |
| C | 79746 | 765 | 0.959296% |
| D | 79749 | 1016 | 1.273997% |
Noise dominated data is calculated using 1-second bins in cleaned event files. If a bin has >2000 counts, and if more than 50% of those come from <1% of pixels, then it is considered to be noise-dominated and hence unusable.
| Quadrant | # 1 sec bins | Bins with >0 counts | Bins with >2000 counts | High rate bins dominated by noise | Noise dominated (total time) | Noise dominated (detector-on time) | Marked lightcurve |
|---|---|---|---|---|---|---|---|
| A | 92032 | 79762 | 6760 | 6760 | 7.35% | 8.48% |  |
| B | 92032 | 79763 | 104 | 104 | 0.11% | 0.13% |  |
| C | 92032 | 79768 | 78 | 78 | 0.08% | 0.10% |  |
| D | 92032 | 79767 | 314 | 314 | 0.34% | 0.39% |  |
Top three noisy pixels from each quadrant. If the there are fewer than three noisy pixels in the level2.evt file, extra rows are filled as -1
| Pixel properties | Quadrant properties | ||||||
|---|---|---|---|---|---|---|---|
| Quadrant | DetID | PixID | Counts | Sigma | Mean | Median | Sigma |
| A | 15 | 234 | 20826627 | 11473.45 | 9035 | 8855 | 1814.4 |
| A | 0 | 23 | 2263736 | 1242.75 | 9035 | 8855 | 1814.4 |
| A | 15 | 239 | 611790 | 332.3 | 9035 | 8855 | 1814.4 |
| B | 0 | 214 | 1089281 | 590.81 | 9737 | 9520 | 1827.6 |
| B | 0 | 187 | 410564 | 219.44 | 9737 | 9520 | 1827.6 |
| B | 4 | 81 | 364402 | 194.18 | 9737 | 9520 | 1827.6 |
| C | 9 | 54 | 605062 | 275.88 | 9373 | 9414 | 2159.1 |
| C | 13 | 61 | 71912 | 28.95 | 9373 | 9414 | 2159.1 |
| C | 8 | 128 | 39034 | 13.72 | 9373 | 9414 | 2159.1 |
| D | 1 | 7 | 952673 | 385.24 | 9355 | 9137 | 2449.2 |
| D | 2 | 14 | 380650 | 151.69 | 9355 | 9137 | 2449.2 |
| D | 1 | 52 | 344837 | 137.06 | 9355 | 9137 | 2449.2 |
Histogram calculated using DETX and DETY for each event in the final _common_clean file
| Quadrant A | 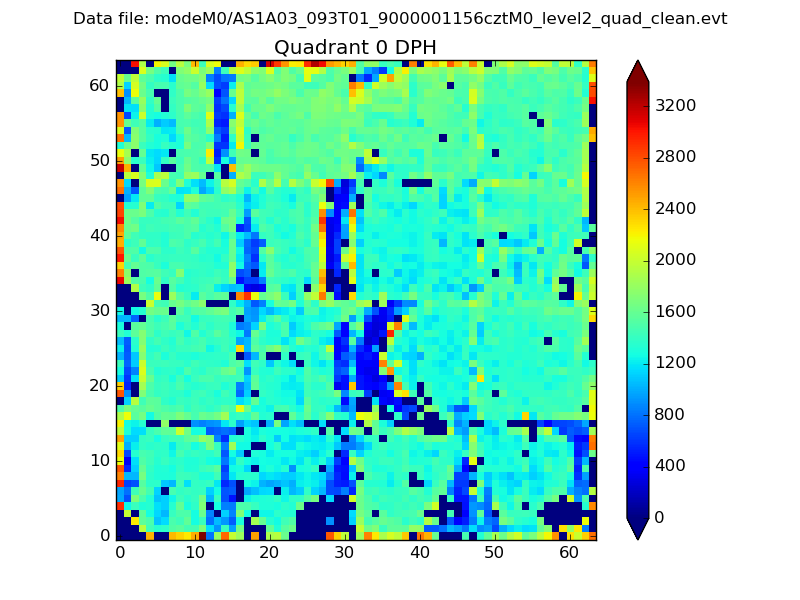 |
 |
Quadrant B |
|---|---|---|---|
| Quadrant D |  |
 |
Quadrant C |
| Plot type | Count rate plots | Images |
|---|---|---|
| Comparison with Poisson distribution Blue bars denote a histogram of data divided into 1 sec bins. Red curve is a Poisson curve with rate = median count rate of data. |
 |
 |
| Quadrant-wise count rates Data is divided into 100 sec bins |
 |
|
| Module-wise count rates for Quadrant A Data is divided into 100 sec bins |
 |
 |
| Module-wise count rates for Quadrant B Data is divided into 100 sec bins |
 |
 |
| Module-wise count rates for Quadrant C Data is divided into 100 sec bins |
 |
 |
| Module-wise count rates for Quadrant D Data is divided into 100 sec bins |
 |
 |
| Parameter | Plot |
|---|---|
| CZT HV Monitor |  |
| D_VDD |  |
| Temperature 1 |  |
| Veto HV Monitor |  |
| Veto LLD |  |
| Alpha Counter |  |
| _CPM_Rate |  |
| CZT Counter |  |
| +2.5 Volts monitor |  |
| +5 Volts monitor | 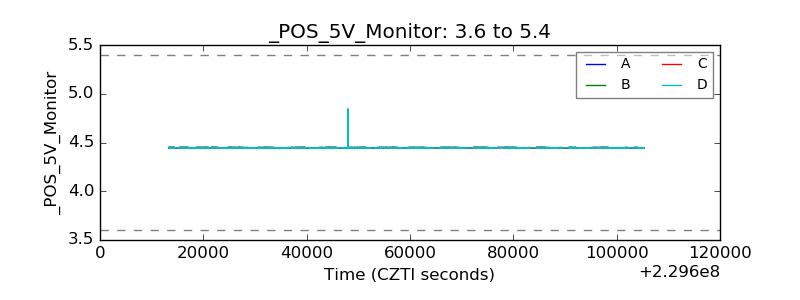 |
| _ROLL_ROT |  |
| _Roll_DEC |  |
| _Roll_RA |  |
| Veto Counter |  |