| Param | Original file | Final file |
|---|---|---|
| Filename | modeM0/AS1T01_163T01_9000001152cztM0_level2.evt | modeM0/AS1T01_163T01_9000001152cztM0_level2_quad_clean.evt |
| Size (bytes) | 4,901,420,160 | 912,723,840 |
| Size | 4.6 GB | 870.4 MB |
| Events in quadrant A | 36,569,954 | 5,745,527 |
| Events in quadrant B | 35,829,935 | 5,823,123 |
| Events in quadrant C | 33,483,135 | 5,671,011 |
| Events in quadrant D | 37,727,812 | 5,499,095 |
| Mode M9 | |||
|---|---|---|---|
| Quadrant | BADHDUFLAG | Total packets | Discarded packets |
| A | 0 | 103 | 0 |
| B | 0 | 103 | 0 |
| C | 0 | 103 | 0 |
| D | 0 | 103 | 0 |
| Mode SS | |||
|---|---|---|---|
| Quadrant | BADHDUFLAG | Total packets | Discarded packets |
| A | 0 | 1462 | 0 |
| B | 0 | 1462 | 0 |
| C | 0 | 1462 | 0 |
| D | 0 | 1462 | 0 |
| Mode M0 | |||
|---|---|---|---|
| Quadrant | BADHDUFLAG | Total packets | Discarded packets |
| A | 0 | 156574 | 0 |
| B | 0 | 153015 | 0 |
| C | 0 | 148953 | 0 |
| D | 0 | 162115 | 0 |
| Quadrant | Total seconds | Saturated seconds | Saturation percentage |
|---|---|---|---|
| A | 71549 | 1517 | 2.120225% |
| B | 71550 | 1130 | 1.579315% |
| C | 71549 | 618 | 0.863744% |
| D | 71550 | 1210 | 1.691125% |
Noise dominated data is calculated using 1-second bins in cleaned event files. If a bin has >2000 counts, and if more than 50% of those come from <1% of pixels, then it is considered to be noise-dominated and hence unusable.
| Quadrant | # 1 sec bins | Bins with >0 counts | Bins with >2000 counts | High rate bins dominated by noise | Noise dominated (total time) | Noise dominated (detector-on time) | Marked lightcurve |
|---|---|---|---|---|---|---|---|
| A | 82122 | 71563 | 391 | 391 | 0.48% | 0.55% | 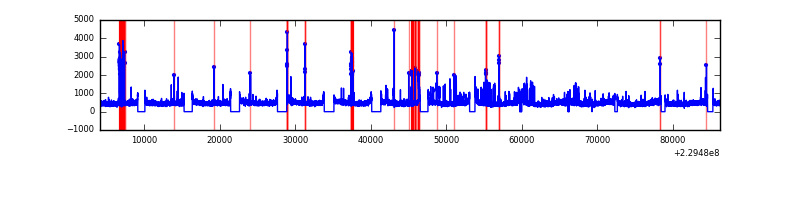 |
| B | 82122 | 71564 | 52 | 52 | 0.06% | 0.07% |  |
| C | 82122 | 71566 | 90 | 90 | 0.11% | 0.13% |  |
| D | 82122 | 71563 | 356 | 356 | 0.43% | 0.50% | 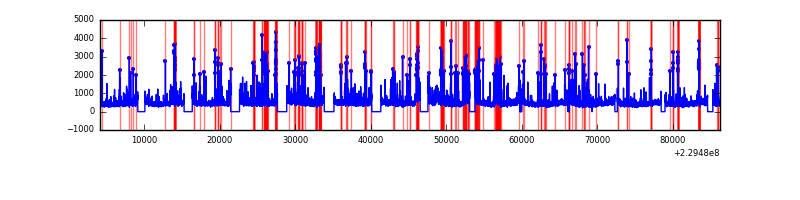 |
Top three noisy pixels from each quadrant. If the there are fewer than three noisy pixels in the level2.evt file, extra rows are filled as -1
| Pixel properties | Quadrant properties | ||||||
|---|---|---|---|---|---|---|---|
| Quadrant | DetID | PixID | Counts | Sigma | Mean | Median | Sigma |
| A | 0 | 23 | 1670257 | 944.26 | 8684 | 8499 | 1759.9 |
| A | 0 | 254 | 821186 | 461.79 | 8684 | 8499 | 1759.9 |
| A | 15 | 234 | 378084 | 210.01 | 8684 | 8499 | 1759.9 |
| B | 0 | 214 | 899576 | 542.94 | 8719 | 8522 | 1641.2 |
| B | 10 | 16 | 286251 | 169.23 | 8719 | 8522 | 1641.2 |
| B | 0 | 219 | 191785 | 111.67 | 8719 | 8522 | 1641.2 |
| C | 9 | 54 | 647029 | 328.45 | 8401 | 8434 | 1944.3 |
| C | 10 | 9 | 70343 | 31.84 | 8401 | 8434 | 1944.3 |
| C | 13 | 61 | 64448 | 28.81 | 8401 | 8434 | 1944.3 |
| D | 1 | 52 | 2547742 | 1150.51 | 8355 | 8172 | 2207.3 |
| D | 8 | 230 | 821035 | 368.25 | 8355 | 8172 | 2207.3 |
| D | 2 | 14 | 779678 | 349.52 | 8355 | 8172 | 2207.3 |
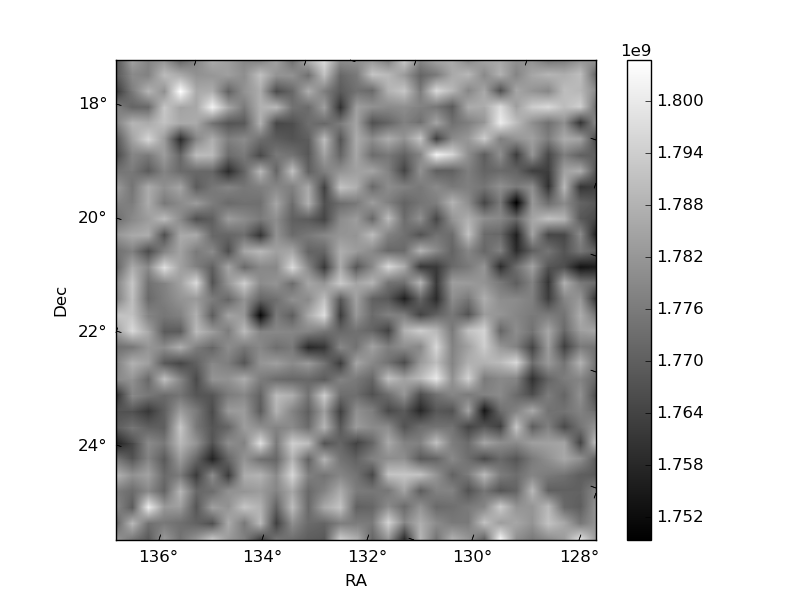
Histogram calculated using DETX and DETY for each event in the final _common_clean file
| Quadrant A |  |
 |
Quadrant B |
|---|---|---|---|
| Quadrant D |  |
 |
Quadrant C |
| Plot type | Count rate plots | Images |
|---|---|---|
| Comparison with Poisson distribution Blue bars denote a histogram of data divided into 1 sec bins. Red curve is a Poisson curve with rate = median count rate of data. |
 |
 |
| Quadrant-wise count rates Data is divided into 100 sec bins |
 |
|
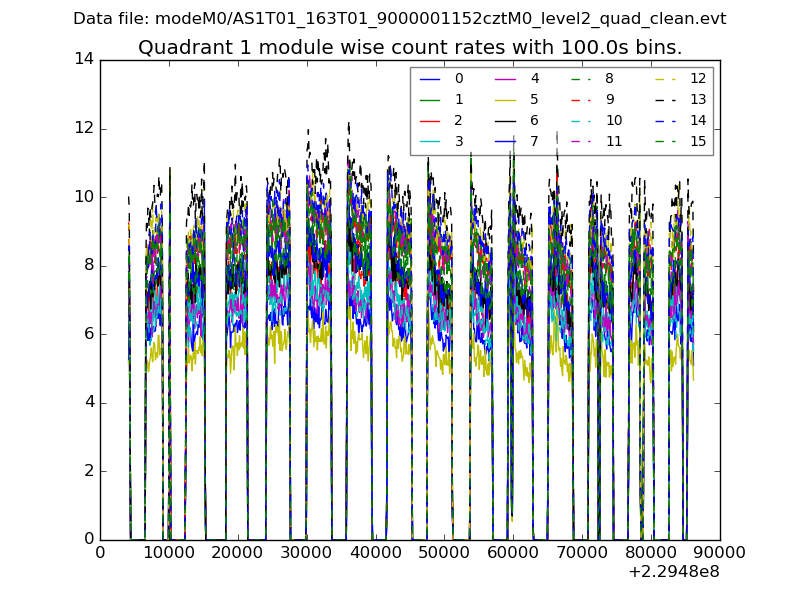
| Module-wise count rates for Quadrant A Data is divided into 100 sec bins |
 |
 |
| Module-wise count rates for Quadrant B Data is divided into 100 sec bins |
 |
 |
| Module-wise count rates for Quadrant C Data is divided into 100 sec bins |
 |
 |
| Module-wise count rates for Quadrant D Data is divided into 100 sec bins |
 |
 |
| Parameter | Plot |
|---|---|
| CZT HV Monitor |  |
| D_VDD |  |
| Temperature 1 | 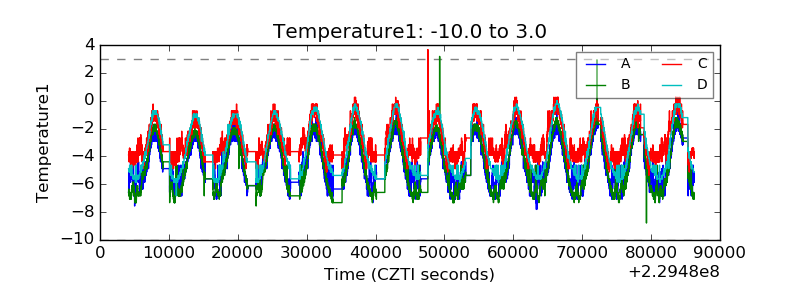 |
| Veto HV Monitor |  |
| Veto LLD | 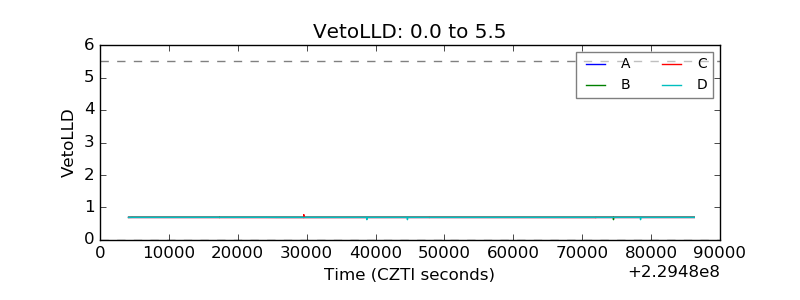 |
| Alpha Counter |  |
| _CPM_Rate |  |
| CZT Counter |  |
| +2.5 Volts monitor | 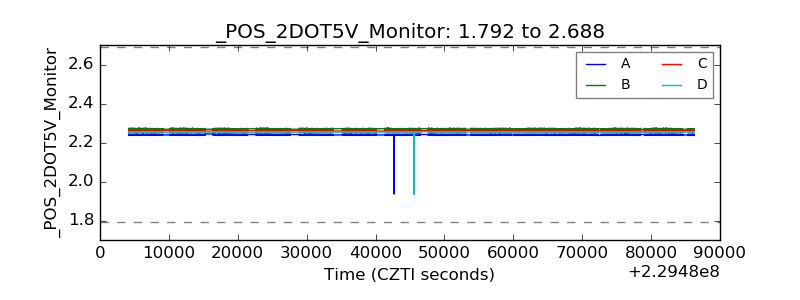 |
| +5 Volts monitor | 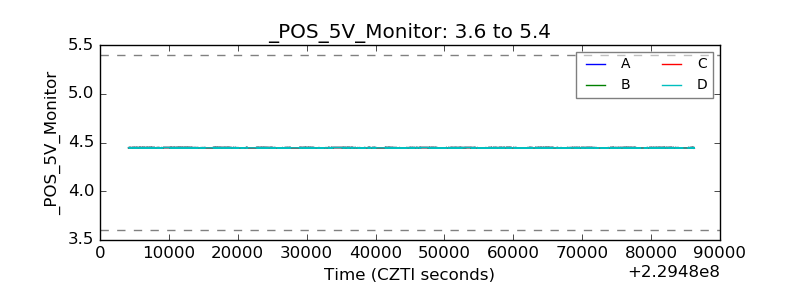 |
| _ROLL_ROT |  |
| _Roll_DEC |  |
| _Roll_RA |  |
| Veto Counter |  |