| Param | Original file | Final file |
|---|---|---|
| Filename | modeM0/AS1G07_086T02_9000001144cztM0_level2.evt | modeM0/AS1G07_086T02_9000001144cztM0_level2_quad_clean.evt |
| Size (bytes) | 2,141,055,360 | 264,738,240 |
| Size | 2.0 GB | 252.5 MB |
| Events in quadrant A | 33,191,855 | 1,109,396 |
| Events in quadrant B | 10,896,817 | 1,866,341 |
| Events in quadrant C | 9,635,074 | 1,816,912 |
| Events in quadrant D | 9,686,579 | 1,761,418 |
| Mode M0 | |||
|---|---|---|---|
| Quadrant | BADHDUFLAG | Total packets | Discarded packets |
| A | 0 | 113305 | 0 |
| B | 0 | 46337 | 0 |
| C | 0 | 43922 | 0 |
| D | 0 | 44512 | 0 |
| Mode SS | |||
|---|---|---|---|
| Quadrant | BADHDUFLAG | Total packets | Discarded packets |
| A | 0 | 432 | 0 |
| B | 0 | 432 | 0 |
| C | 0 | 432 | 0 |
| D | 0 | 432 | 0 |
| Mode M9 | |||
|---|---|---|---|
| Quadrant | BADHDUFLAG | Total packets | Discarded packets |
| A | 0 | 33 | 0 |
| B | 0 | 33 | 0 |
| C | 0 | 33 | 0 |
| D | 0 | 33 | 0 |
| Quadrant | Total seconds | Saturated seconds | Saturation percentage |
|---|---|---|---|
| A | 21225 | 10775 | 50.765607% |
| B | 21225 | 498 | 2.346290% |
| C | 21224 | 220 | 1.036562% |
| D | 21226 | 248 | 1.168378% |
Noise dominated data is calculated using 1-second bins in cleaned event files. If a bin has >2000 counts, and if more than 50% of those come from <1% of pixels, then it is considered to be noise-dominated and hence unusable.
| Quadrant | # 1 sec bins | Bins with >0 counts | Bins with >2000 counts | High rate bins dominated by noise | Noise dominated (total time) | Noise dominated (detector-on time) | Marked lightcurve |
|---|---|---|---|---|---|---|---|
| A | 28525 | 21229 | 9195 | 9195 | 32.23% | 43.31% |  |
| B | 28525 | 21232 | 55 | 55 | 0.19% | 0.26% |  |
| C | 28525 | 21234 | 3 | 3 | 0.01% | 0.01% |  |
| D | 28525 | 21233 | 15 | 15 | 0.05% | 0.07% |  |
Top three noisy pixels from each quadrant. If the there are fewer than three noisy pixels in the level2.evt file, extra rows are filled as -1
| Pixel properties | Quadrant properties | ||||||
|---|---|---|---|---|---|---|---|
| Quadrant | DetID | PixID | Counts | Sigma | Mean | Median | Sigma |
| A | 0 | 128 | 26787408 | 80587.25 | 1633 | 1599 | 332.4 |
| A | 13 | 248 | 59549 | 174.35 | 1633 | 1599 | 332.4 |
| A | 15 | 234 | 57297 | 167.57 | 1633 | 1599 | 332.4 |
| B | 10 | 16 | 421852 | 849.65 | 2568 | 2504 | 493.6 |
| B | 11 | 51 | 226140 | 453.11 | 2568 | 2504 | 493.6 |
| B | 0 | 214 | 159574 | 318.24 | 2568 | 2504 | 493.6 |
| C | 13 | 61 | 19050 | 28.97 | 2465 | 2471 | 572.2 |
| C | 9 | 54 | 13356 | 19.02 | 2465 | 2471 | 572.2 |
| C | 5 | 128 | 8138 | 9.9 | 2465 | 2471 | 572.2 |
| D | 12 | 233 | 120300 | 180.58 | 2448 | 2396 | 652.9 |
| D | 1 | 52 | 102630 | 153.52 | 2448 | 2396 | 652.9 |
| D | 2 | 234 | 72489 | 107.35 | 2448 | 2396 | 652.9 |
Histogram calculated using DETX and DETY for each event in the final _common_clean file
| Quadrant A |  |
 |
Quadrant B |
|---|---|---|---|
| Quadrant D | 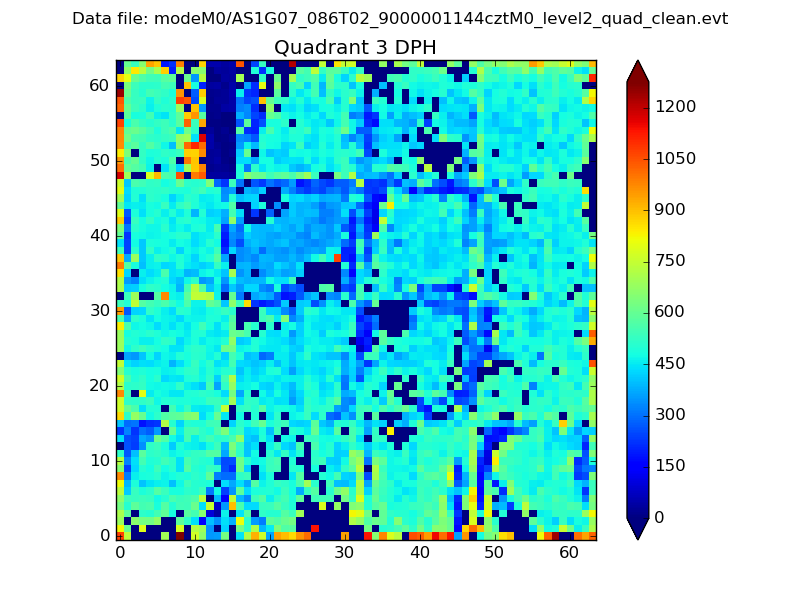 |
 |
Quadrant C |
| Plot type | Count rate plots | Images |
|---|---|---|
| Comparison with Poisson distribution Blue bars denote a histogram of data divided into 1 sec bins. Red curve is a Poisson curve with rate = median count rate of data. |
 |
 |
| Quadrant-wise count rates Data is divided into 100 sec bins |
 |
|
| Module-wise count rates for Quadrant A Data is divided into 100 sec bins |
 |
 |
| Module-wise count rates for Quadrant B Data is divided into 100 sec bins |
 |
 |
| Module-wise count rates for Quadrant C Data is divided into 100 sec bins |
 |
 |
| Module-wise count rates for Quadrant D Data is divided into 100 sec bins |
 |
 |
| Parameter | Plot |
|---|---|
| CZT HV Monitor |  |
| D_VDD | 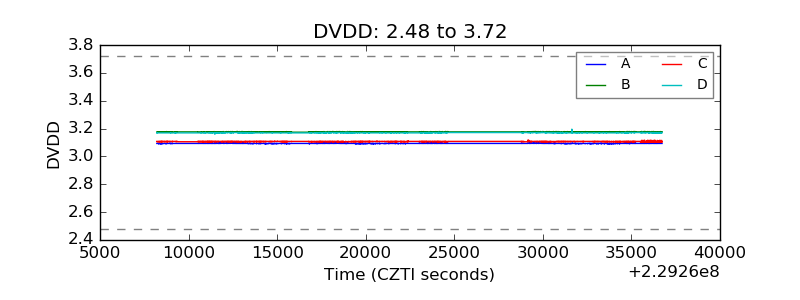 |
| Temperature 1 |  |
| Veto HV Monitor |  |
| Veto LLD |  |
| Alpha Counter |  |
| _CPM_Rate |  |
| CZT Counter |  |
| +2.5 Volts monitor |  |
| +5 Volts monitor |  |
| _ROLL_ROT |  |
| _Roll_DEC |  |
| _Roll_RA |  |
| Veto Counter |  |