| Param | Original file | Final file |
|---|---|---|
| Filename | modeM0/AS1C02_028T01_9000001146cztM0_level2.evt | modeM0/AS1C02_028T01_9000001146cztM0_level2_quad_clean.evt |
| Size (bytes) | 2,387,989,440 | 200,096,640 |
| Size | 2.2 GB | 190.8 MB |
| Events in quadrant A | 43,080,874 | 685,771 |
| Events in quadrant B | 9,087,627 | 1,364,326 |
| Events in quadrant C | 8,688,726 | 1,346,858 |
| Events in quadrant D | 10,131,693 | 1,298,391 |
| Mode SS | |||
|---|---|---|---|
| Quadrant | BADHDUFLAG | Total packets | Discarded packets |
| A | 0 | 404 | 0 |
| B | 0 | 404 | 0 |
| C | 0 | 404 | 0 |
| D | 0 | 404 | 0 |
| Mode M9 | |||
|---|---|---|---|
| Quadrant | BADHDUFLAG | Total packets | Discarded packets |
| A | 0 | 17 | 0 |
| B | 0 | 17 | 0 |
| C | 0 | 17 | 0 |
| D | 0 | 17 | 0 |
| Mode M0 | |||
|---|---|---|---|
| Quadrant | BADHDUFLAG | Total packets | Discarded packets |
| A | 0 | 141216 | 0 |
| B | 0 | 40613 | 0 |
| C | 0 | 39988 | 0 |
| D | 0 | 44200 | 0 |
| Quadrant | Total seconds | Saturated seconds | Saturation percentage |
|---|---|---|---|
| A | 19755 | 14947 | 75.661858% |
| B | 19755 | 73 | 0.369527% |
| C | 19755 | 29 | 0.146798% |
| D | 19755 | 231 | 1.169324% |
Noise dominated data is calculated using 1-second bins in cleaned event files. If a bin has >2000 counts, and if more than 50% of those come from <1% of pixels, then it is considered to be noise-dominated and hence unusable.
| Quadrant | # 1 sec bins | Bins with >0 counts | Bins with >2000 counts | High rate bins dominated by noise | Noise dominated (total time) | Noise dominated (detector-on time) | Marked lightcurve |
|---|---|---|---|---|---|---|---|
| A | 21600 | 19757 | 14114 | 14114 | 65.34% | 71.44% |  |
| B | 21600 | 19758 | 13 | 13 | 0.06% | 0.07% |  |
| C | 21600 | 19758 | 1 | 1 | 0.00% | 0.01% |  |
| D | 21600 | 19758 | 188 | 188 | 0.87% | 0.95% |  |
Top three noisy pixels from each quadrant. If the there are fewer than three noisy pixels in the level2.evt file, extra rows are filled as -1
| Pixel properties | Quadrant properties | ||||||
|---|---|---|---|---|---|---|---|
| Quadrant | DetID | PixID | Counts | Sigma | Mean | Median | Sigma |
| A | 0 | 128 | 39001106 | 182065.05 | 1058 | 1035 | 214.2 |
| A | 8 | 15 | 9955 | 41.64 | 1058 | 1035 | 214.2 |
| A | 12 | 194 | 9264 | 38.41 | 1058 | 1035 | 214.2 |
| B | 0 | 214 | 118276 | 265.97 | 2282 | 2228 | 436.3 |
| B | 11 | 51 | 60683 | 133.97 | 2282 | 2228 | 436.3 |
| B | 12 | 111 | 49417 | 108.15 | 2282 | 2228 | 436.3 |
| C | 9 | 54 | 19967 | 34.6 | 2218 | 2225 | 512.7 |
| C | 13 | 61 | 16757 | 28.34 | 2218 | 2225 | 512.7 |
| C | 8 | 128 | 10017 | 15.2 | 2218 | 2225 | 512.7 |
| D | 1 | 52 | 1291831 | 2419.84 | 2194 | 2135 | 533.0 |
| D | 1 | 159 | 173589 | 321.7 | 2194 | 2135 | 533.0 |
| D | 13 | 105 | 139644 | 258.01 | 2194 | 2135 | 533.0 |
Histogram calculated using DETX and DETY for each event in the final _common_clean file
| Quadrant A |  |
 |
Quadrant B |
|---|---|---|---|
| Quadrant D |  |
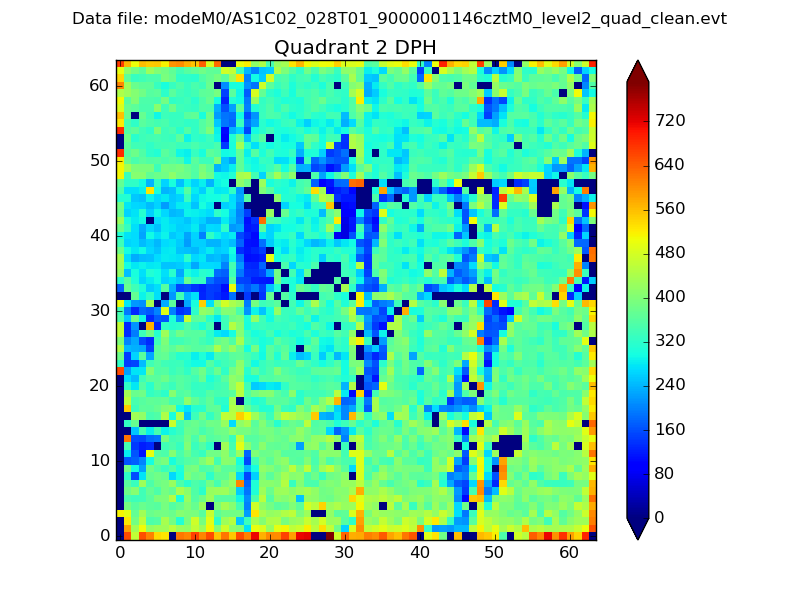 |
Quadrant C |
| Plot type | Count rate plots | Images |
|---|---|---|
| Comparison with Poisson distribution Blue bars denote a histogram of data divided into 1 sec bins. Red curve is a Poisson curve with rate = median count rate of data. |
 |
 |
| Quadrant-wise count rates Data is divided into 100 sec bins |
 |
|
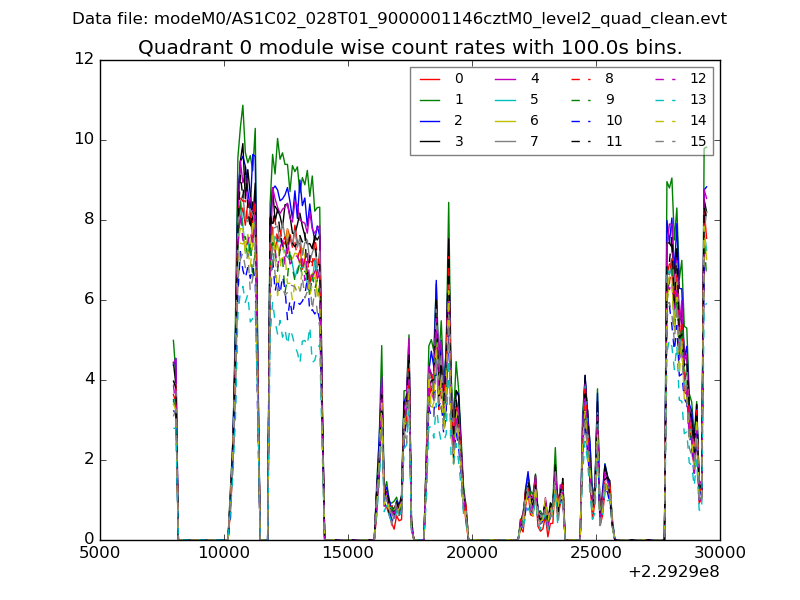
| Module-wise count rates for Quadrant A Data is divided into 100 sec bins |
 |
 |
| Module-wise count rates for Quadrant B Data is divided into 100 sec bins |
 |
 |
| Module-wise count rates for Quadrant C Data is divided into 100 sec bins |
 |
 |
| Module-wise count rates for Quadrant D Data is divided into 100 sec bins |
 |
 |
| Parameter | Plot |
|---|---|
| CZT HV Monitor |  |
| D_VDD |  |
| Temperature 1 | 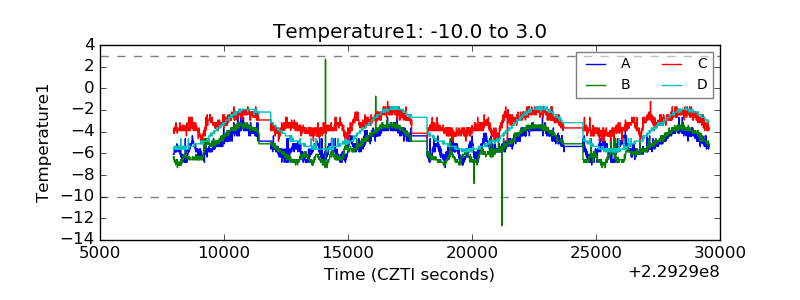 |
| Veto HV Monitor |  |
| Veto LLD |  |
| Alpha Counter |  |
| _CPM_Rate |  |
| CZT Counter |  |
| +2.5 Volts monitor | 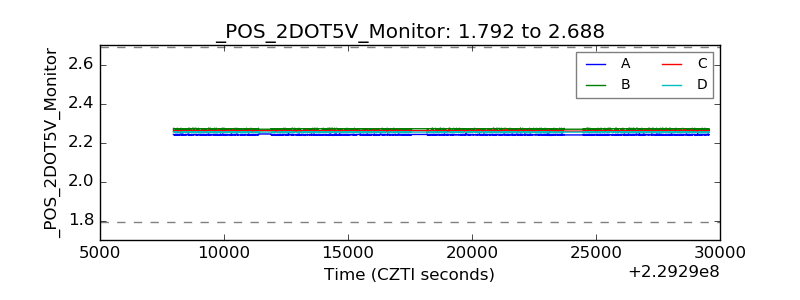 |
| +5 Volts monitor |  |
| _ROLL_ROT |  |
| _Roll_DEC |  |
| _Roll_RA |  |
| Veto Counter |  |