| Param | Original file | Final file |
|---|---|---|
| Filename | modeM0/AS1T01_164T01_9000001140cztM0_level2.evt | modeM0/AS1T01_164T01_9000001140cztM0_level2_quad_clean.evt |
| Size (bytes) | 1,261,725,120 | 234,694,080 |
| Size | 1.2 GB | 223.8 MB |
| Events in quadrant A | 9,046,868 | 1,468,922 |
| Events in quadrant B | 9,764,623 | 1,490,312 |
| Events in quadrant C | 8,553,944 | 1,479,562 |
| Events in quadrant D | 9,603,775 | 1,403,778 |
| Mode M9 | |||
|---|---|---|---|
| Quadrant | BADHDUFLAG | Total packets | Discarded packets |
| A | 0 | 26 | 0 |
| B | 0 | 26 | 0 |
| C | 0 | 26 | 0 |
| D | 0 | 26 | 0 |
| Mode M0 | |||
|---|---|---|---|
| Quadrant | BADHDUFLAG | Total packets | Discarded packets |
| A | 0 | 39055 | 0 |
| B | 0 | 41118 | 0 |
| C | 0 | 37992 | 0 |
| D | 0 | 41393 | 0 |
| Mode SS | |||
|---|---|---|---|
| Quadrant | BADHDUFLAG | Total packets | Discarded packets |
| A | 0 | 374 | 0 |
| B | 0 | 374 | 0 |
| C | 0 | 374 | 0 |
| D | 0 | 374 | 0 |
| Quadrant | Total seconds | Saturated seconds | Saturation percentage |
|---|---|---|---|
| A | 18376 | 328 | 1.784937% |
| B | 18375 | 435 | 2.367347% |
| C | 18376 | 139 | 0.756421% |
| D | 18368 | 319 | 1.736716% |
Noise dominated data is calculated using 1-second bins in cleaned event files. If a bin has >2000 counts, and if more than 50% of those come from <1% of pixels, then it is considered to be noise-dominated and hence unusable.
| Quadrant | # 1 sec bins | Bins with >0 counts | Bins with >2000 counts | High rate bins dominated by noise | Noise dominated (total time) | Noise dominated (detector-on time) | Marked lightcurve |
|---|---|---|---|---|---|---|---|
| A | 20917 | 18392 | 53 | 53 | 0.25% | 0.29% |  |
| B | 20917 | 18394 | 58 | 58 | 0.28% | 0.32% |  |
| C | 20917 | 18392 | 3 | 3 | 0.01% | 0.02% |  |
| D | 20917 | 18392 | 143 | 143 | 0.68% | 0.78% |  |
Top three noisy pixels from each quadrant. If the there are fewer than three noisy pixels in the level2.evt file, extra rows are filled as -1
| Pixel properties | Quadrant properties | ||||||
|---|---|---|---|---|---|---|---|
| Quadrant | DetID | PixID | Counts | Sigma | Mean | Median | Sigma |
| A | 8 | 15 | 198574 | 433.78 | 2233 | 2191 | 452.7 |
| A | 15 | 234 | 155837 | 339.38 | 2233 | 2191 | 452.7 |
| A | 5 | 16 | 45413 | 95.47 | 2233 | 2191 | 452.7 |
| B | 10 | 16 | 467837 | 1084.43 | 2251 | 2200 | 429.4 |
| B | 11 | 51 | 247510 | 571.31 | 2251 | 2200 | 429.4 |
| B | 0 | 214 | 172658 | 396.98 | 2251 | 2200 | 429.4 |
| C | 13 | 61 | 16598 | 28.43 | 2189 | 2200 | 506.5 |
| C | 3 | 233 | 15210 | 25.69 | 2189 | 2200 | 506.5 |
| C | 12 | 4 | 10146 | 15.69 | 2189 | 2200 | 506.5 |
| D | 1 | 52 | 871490 | 1633.13 | 2182 | 2121 | 532.3 |
| D | 13 | 105 | 238945 | 444.88 | 2182 | 2121 | 532.3 |
| D | 8 | 230 | 141539 | 261.9 | 2182 | 2121 | 532.3 |
Histogram calculated using DETX and DETY for each event in the final _common_clean file
| Quadrant A | 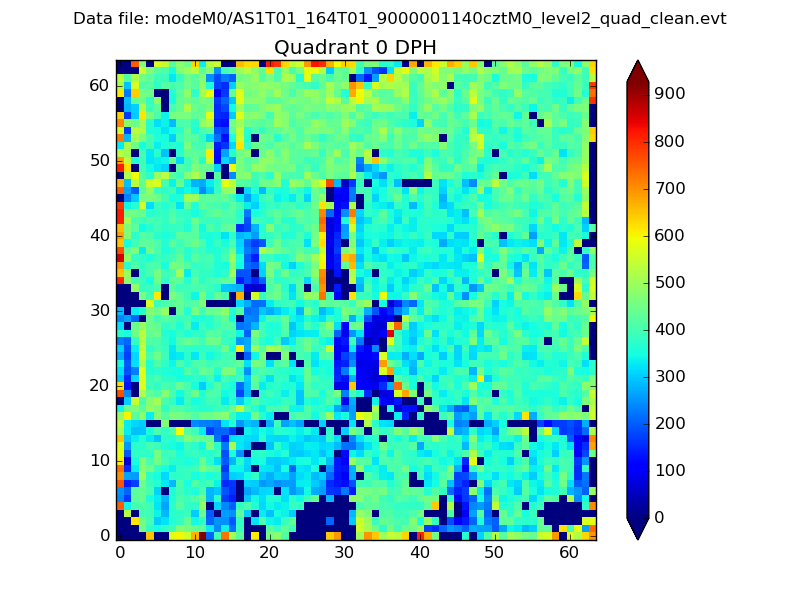 |
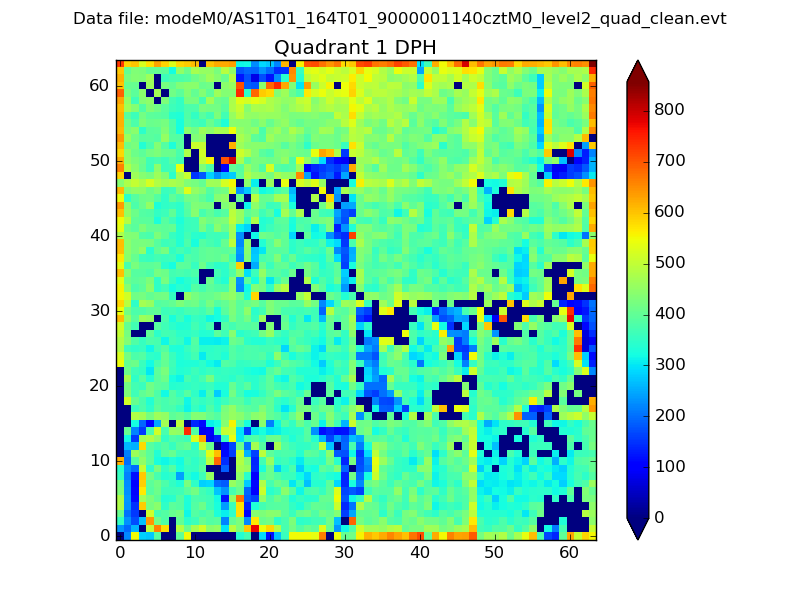 |
Quadrant B |
|---|---|---|---|
| Quadrant D |  |
 |
Quadrant C |
| Plot type | Count rate plots | Images |
|---|---|---|
| Comparison with Poisson distribution Blue bars denote a histogram of data divided into 1 sec bins. Red curve is a Poisson curve with rate = median count rate of data. |
 |
 |
| Quadrant-wise count rates Data is divided into 100 sec bins |
 |
|
| Module-wise count rates for Quadrant A Data is divided into 100 sec bins |
 |
 |
| Module-wise count rates for Quadrant B Data is divided into 100 sec bins |
 |
 |
| Module-wise count rates for Quadrant C Data is divided into 100 sec bins |
 |
 |
| Module-wise count rates for Quadrant D Data is divided into 100 sec bins |
 |
 |
| Parameter | Plot |
|---|---|
| CZT HV Monitor | 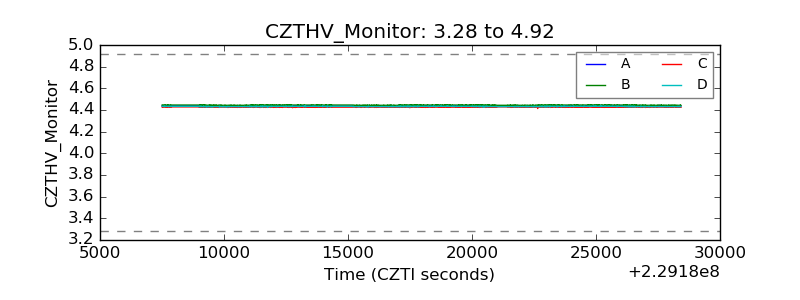 |
| D_VDD |  |
| Temperature 1 |  |
| Veto HV Monitor |  |
| Veto LLD | 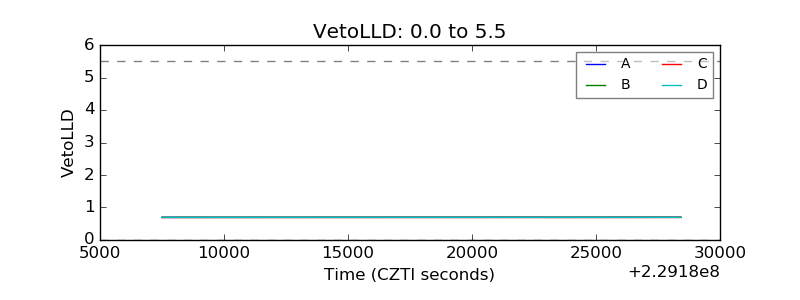 |
| Alpha Counter | 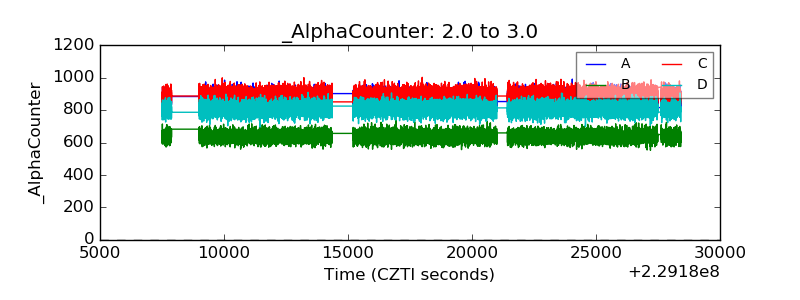 |
| _CPM_Rate | 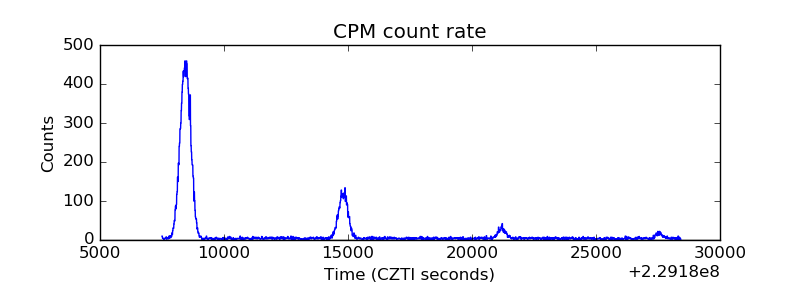 |
| CZT Counter |  |
| +2.5 Volts monitor |  |
| +5 Volts monitor | 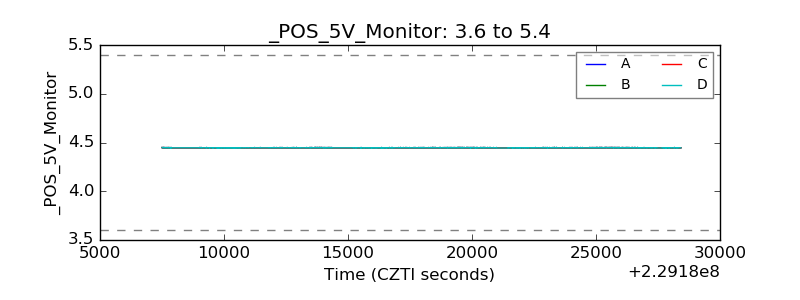 |
| _ROLL_ROT | 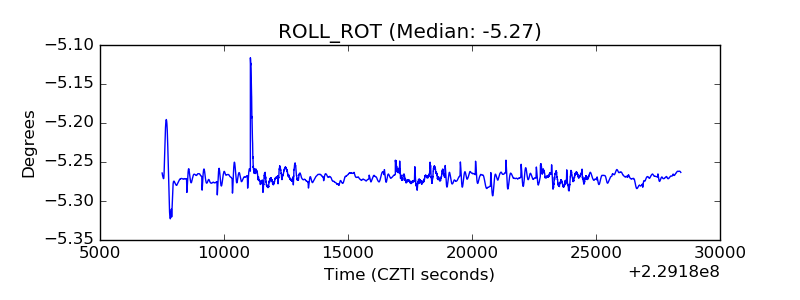 |
| _Roll_DEC |  |
| _Roll_RA |  |
| Veto Counter |  |