| Param | Original file | Final file |
|---|---|---|
| Filename | modeM0/AS1G07_086T01_9000001142cztM0_level2.evt | modeM0/AS1G07_086T01_9000001142cztM0_level2_quad_clean.evt |
| Size (bytes) | 3,302,328,960 | 633,804,480 |
| Size | 3.1 GB | 604.4 MB |
| Events in quadrant A | 23,198,931 | 3,974,438 |
| Events in quadrant B | 26,084,301 | 4,020,685 |
| Events in quadrant C | 22,575,097 | 3,952,366 |
| Events in quadrant D | 24,769,597 | 3,812,241 |
| Mode M9 | |||
|---|---|---|---|
| Quadrant | BADHDUFLAG | Total packets | Discarded packets |
| A | 0 | 81 | 0 |
| B | 0 | 81 | 0 |
| C | 0 | 81 | 0 |
| D | 0 | 81 | 0 |
| Mode M0 | |||
|---|---|---|---|
| Quadrant | BADHDUFLAG | Total packets | Discarded packets |
| A | 0 | 102918 | 0 |
| B | 0 | 110049 | 0 |
| C | 0 | 102452 | 0 |
| D | 0 | 109314 | 0 |
| Mode SS | |||
|---|---|---|---|
| Quadrant | BADHDUFLAG | Total packets | Discarded packets |
| A | 0 | 1022 | 0 |
| B | 0 | 1020 | 0 |
| C | 0 | 1022 | 0 |
| D | 0 | 1022 | 0 |
| Quadrant | Total seconds | Saturated seconds | Saturation percentage |
|---|---|---|---|
| A | 50100 | 430 | 0.858283% |
| B | 50091 | 683 | 1.363518% |
| C | 50098 | 359 | 0.716595% |
| D | 50095 | 660 | 1.317497% |
Noise dominated data is calculated using 1-second bins in cleaned event files. If a bin has >2000 counts, and if more than 50% of those come from <1% of pixels, then it is considered to be noise-dominated and hence unusable.
| Quadrant | # 1 sec bins | Bins with >0 counts | Bins with >2000 counts | High rate bins dominated by noise | Noise dominated (total time) | Noise dominated (detector-on time) | Marked lightcurve |
|---|---|---|---|---|---|---|---|
| A | 58310 | 50121 | 13 | 13 | 0.02% | 0.03% |  |
| B | 58310 | 50121 | 193 | 193 | 0.33% | 0.39% | 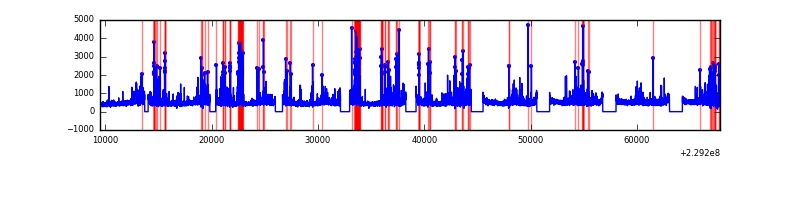 |
| C | 58310 | 50120 | 5 | 5 | 0.01% | 0.01% |  |
| D | 58310 | 50120 | 285 | 285 | 0.49% | 0.57% |  |
Top three noisy pixels from each quadrant. If the there are fewer than three noisy pixels in the level2.evt file, extra rows are filled as -1
| Pixel properties | Quadrant properties | ||||||
|---|---|---|---|---|---|---|---|
| Quadrant | DetID | PixID | Counts | Sigma | Mean | Median | Sigma |
| A | 8 | 15 | 108554 | 85.66 | 5953 | 5827 | 1199.2 |
| A | 15 | 234 | 71746 | 54.97 | 5953 | 5827 | 1199.2 |
| A | 13 | 248 | 67256 | 51.22 | 5953 | 5827 | 1199.2 |
| B | 10 | 16 | 1541741 | 1374.91 | 5977 | 5839 | 1117.1 |
| B | 0 | 214 | 666005 | 590.97 | 5977 | 5839 | 1117.1 |
| B | 11 | 51 | 505308 | 447.12 | 5977 | 5839 | 1117.1 |
| C | 5 | 128 | 48792 | 32.33 | 5773 | 5793 | 1330.0 |
| C | 13 | 61 | 44456 | 29.07 | 5773 | 5793 | 1330.0 |
| C | 8 | 128 | 19680 | 10.44 | 5773 | 5793 | 1330.0 |
| D | 1 | 52 | 1479435 | 970.88 | 5711 | 5581 | 1518.1 |
| D | 13 | 105 | 565979 | 369.15 | 5711 | 5581 | 1518.1 |
| D | 8 | 230 | 520895 | 339.45 | 5711 | 5581 | 1518.1 |
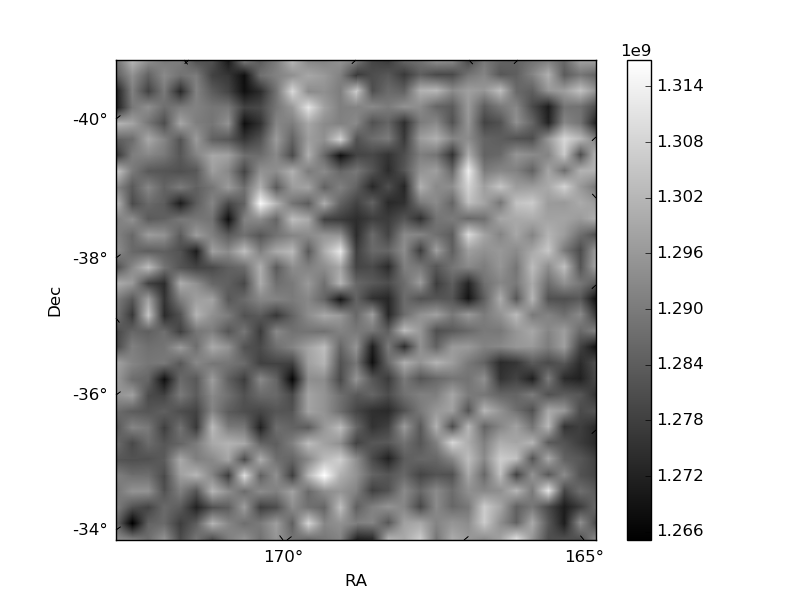
Histogram calculated using DETX and DETY for each event in the final _common_clean file
| Quadrant A |  |
 |
Quadrant B |
|---|---|---|---|
| Quadrant D |  |
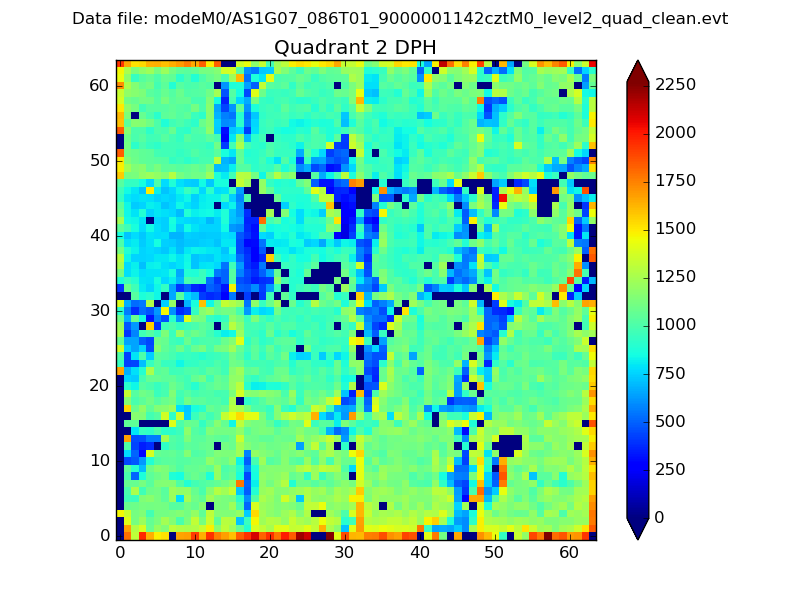 |
Quadrant C |
| Plot type | Count rate plots | Images |
|---|---|---|
| Comparison with Poisson distribution Blue bars denote a histogram of data divided into 1 sec bins. Red curve is a Poisson curve with rate = median count rate of data. |
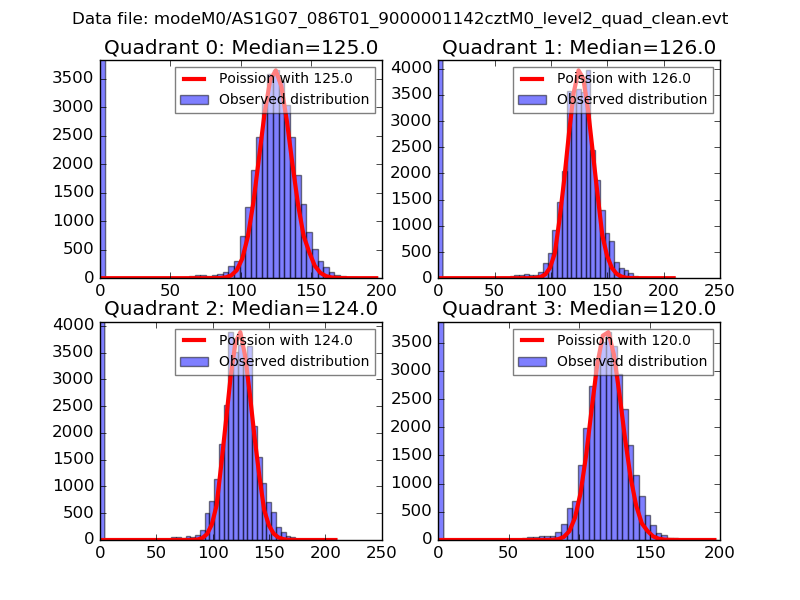 |
 |
| Quadrant-wise count rates Data is divided into 100 sec bins |
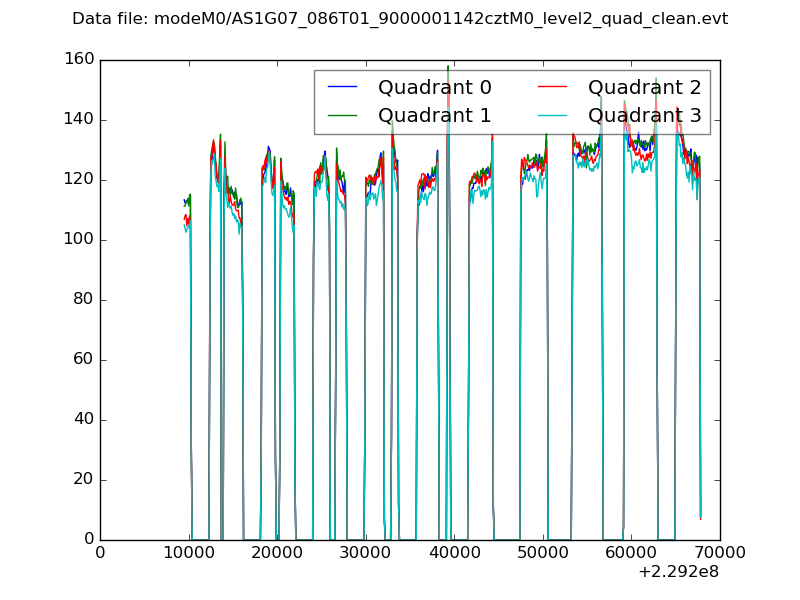 |
|
| Module-wise count rates for Quadrant A Data is divided into 100 sec bins |
 |
 |
| Module-wise count rates for Quadrant B Data is divided into 100 sec bins |
 |
 |
| Module-wise count rates for Quadrant C Data is divided into 100 sec bins |
 |
 |
| Module-wise count rates for Quadrant D Data is divided into 100 sec bins |
 |
 |
| Parameter | Plot |
|---|---|
| CZT HV Monitor | 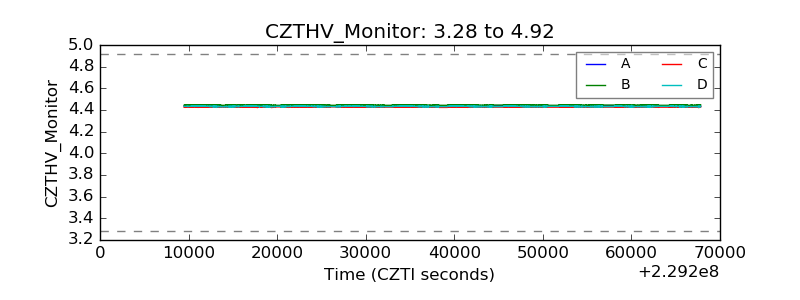 |
| D_VDD |  |
| Temperature 1 |  |
| Veto HV Monitor |  |
| Veto LLD | 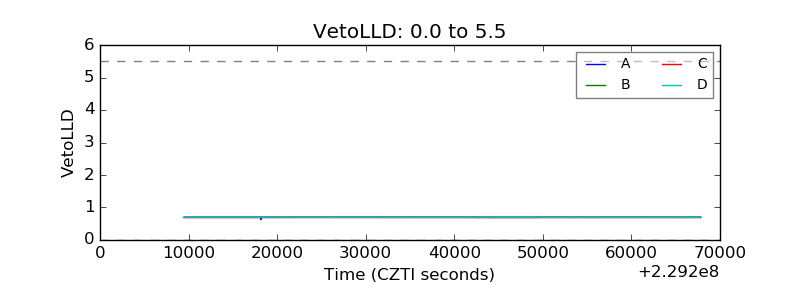 |
| Alpha Counter |  |
| _CPM_Rate |  |
| CZT Counter |  |
| +2.5 Volts monitor |  |
| +5 Volts monitor |  |
| _ROLL_ROT | 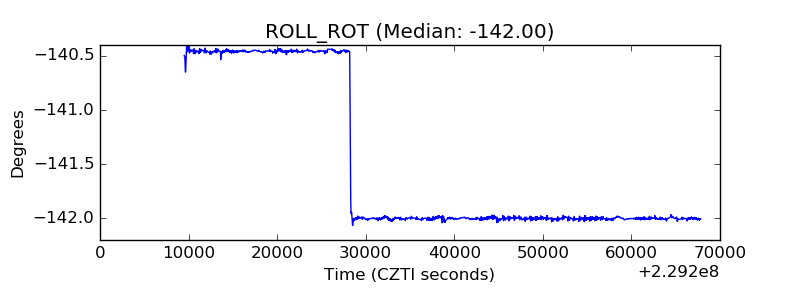 |
| _Roll_DEC | 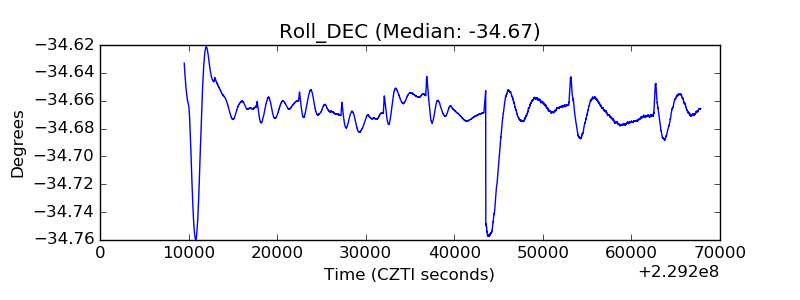 |
| _Roll_RA | 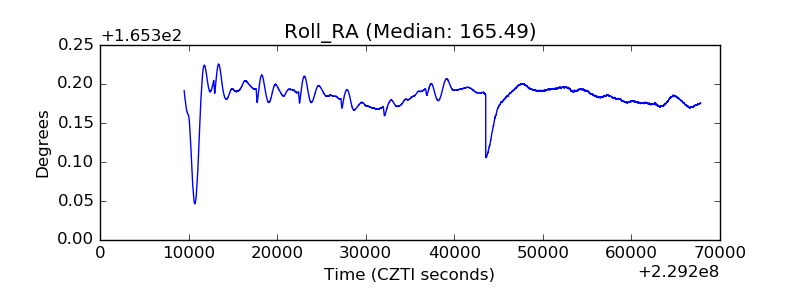 |
| Veto Counter | 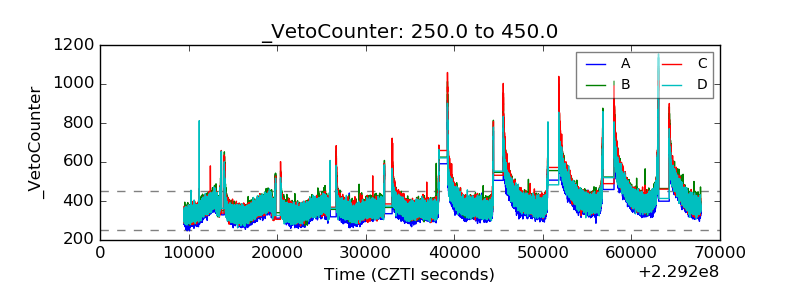 |