| Param | Original file | Final file |
|---|---|---|
| Filename | modeM0/AS1G07_070T01_9000001138cztM0_level2.evt | modeM0/AS1G07_070T01_9000001138cztM0_level2_quad_clean.evt |
| Size (bytes) | 2,577,476,160 | 495,806,400 |
| Size | 2.4 GB | 472.8 MB |
| Events in quadrant A | 17,866,445 | 3,183,347 |
| Events in quadrant B | 18,698,450 | 3,206,570 |
| Events in quadrant C | 17,023,108 | 3,152,591 |
| Events in quadrant D | 22,053,649 | 3,015,053 |
| Mode M0 | |||
|---|---|---|---|
| Quadrant | BADHDUFLAG | Total packets | Discarded packets |
| A | 0 | 76480 | 0 |
| B | 0 | 77945 | 0 |
| C | 0 | 75272 | 0 |
| D | 0 | 90289 | 0 |
| Mode M9 | |||
|---|---|---|---|
| Quadrant | BADHDUFLAG | Total packets | Discarded packets |
| A | 0 | 76 | 0 |
| B | 0 | 76 | 0 |
| C | 0 | 76 | 0 |
| D | 0 | 76 | 0 |
| Mode SS | |||
|---|---|---|---|
| Quadrant | BADHDUFLAG | Total packets | Discarded packets |
| A | 0 | 730 | 0 |
| B | 0 | 730 | 0 |
| C | 0 | 730 | 0 |
| D | 0 | 730 | 0 |
| Quadrant | Total seconds | Saturated seconds | Saturation percentage |
|---|---|---|---|
| A | 35822 | 580 | 1.619117% |
| B | 35823 | 582 | 1.624655% |
| C | 35823 | 384 | 1.071937% |
| D | 35823 | 1285 | 3.587081% |
Noise dominated data is calculated using 1-second bins in cleaned event files. If a bin has >2000 counts, and if more than 50% of those come from <1% of pixels, then it is considered to be noise-dominated and hence unusable.
| Quadrant | # 1 sec bins | Bins with >0 counts | Bins with >2000 counts | High rate bins dominated by noise | Noise dominated (total time) | Noise dominated (detector-on time) | Marked lightcurve |
|---|---|---|---|---|---|---|---|
| A | 43358 | 35826 | 121 | 121 | 0.28% | 0.34% |  |
| B | 43358 | 35826 | 82 | 82 | 0.19% | 0.23% |  |
| C | 43358 | 35826 | 0 | 0 | 0.00% | 0.00% | 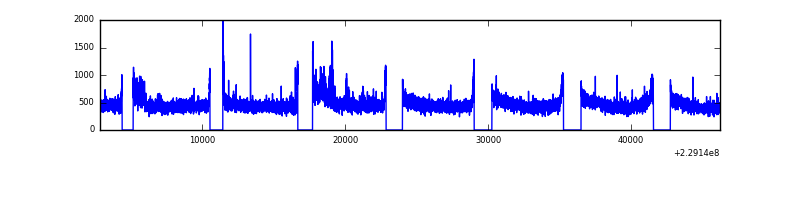 |
| D | 43358 | 35825 | 855 | 855 | 1.97% | 2.39% |  |
Top three noisy pixels from each quadrant. If the there are fewer than three noisy pixels in the level2.evt file, extra rows are filled as -1
| Pixel properties | Quadrant properties | ||||||
|---|---|---|---|---|---|---|---|
| Quadrant | DetID | PixID | Counts | Sigma | Mean | Median | Sigma |
| A | 5 | 16 | 663868 | 752.33 | 4366 | 4268 | 876.7 |
| A | 15 | 79 | 211857 | 236.77 | 4366 | 4268 | 876.7 |
| A | 8 | 15 | 136316 | 150.61 | 4366 | 4268 | 876.7 |
| B | 11 | 51 | 578479 | 700.03 | 4369 | 4270 | 820.3 |
| B | 0 | 214 | 417238 | 503.45 | 4369 | 4270 | 820.3 |
| B | 10 | 16 | 365399 | 440.26 | 4369 | 4270 | 820.3 |
| C | 9 | 68 | 458387 | 470.43 | 4205 | 4222 | 965.4 |
| C | 1 | 16 | 134442 | 134.88 | 4205 | 4222 | 965.4 |
| C | 13 | 61 | 32676 | 29.47 | 4205 | 4222 | 965.4 |
| D | 1 | 52 | 3612063 | 3508.01 | 4199 | 4070 | 1028.5 |
| D | 13 | 105 | 2044128 | 1983.52 | 4199 | 4070 | 1028.5 |
| D | 2 | 14 | 140990 | 133.13 | 4199 | 4070 | 1028.5 |
Histogram calculated using DETX and DETY for each event in the final _common_clean file
| Quadrant A |  |
 |
Quadrant B |
|---|---|---|---|
| Quadrant D | 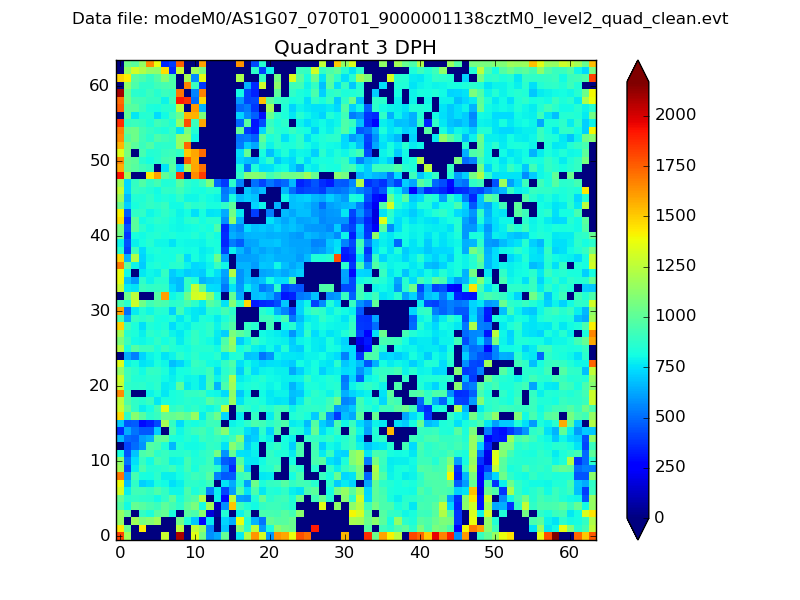 |
 |
Quadrant C |
| Plot type | Count rate plots | Images |
|---|---|---|
| Comparison with Poisson distribution Blue bars denote a histogram of data divided into 1 sec bins. Red curve is a Poisson curve with rate = median count rate of data. |
 |
 |
| Quadrant-wise count rates Data is divided into 100 sec bins |
 |
|
| Module-wise count rates for Quadrant A Data is divided into 100 sec bins |
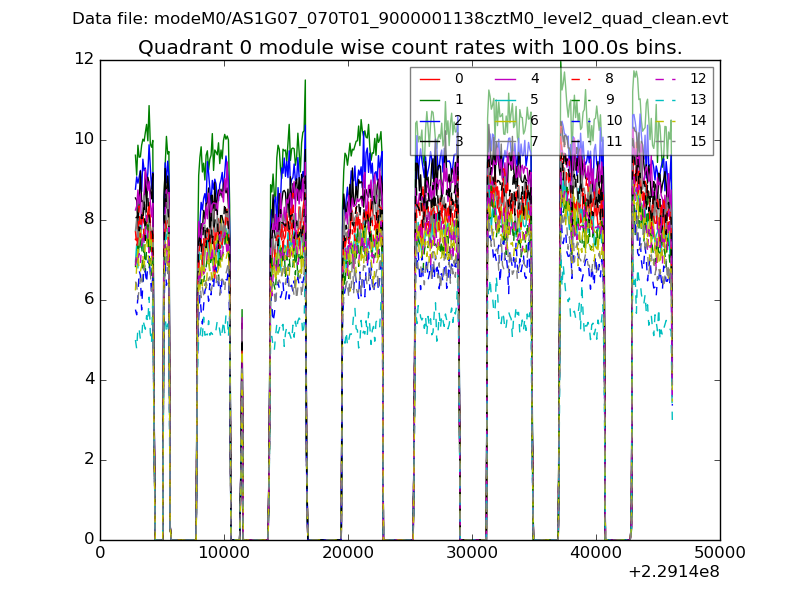 |
 |
| Module-wise count rates for Quadrant B Data is divided into 100 sec bins |
 |
 |
| Module-wise count rates for Quadrant C Data is divided into 100 sec bins |
 |
 |
| Module-wise count rates for Quadrant D Data is divided into 100 sec bins |
 |
 |
| Parameter | Plot |
|---|---|
| CZT HV Monitor |  |
| D_VDD |  |
| Temperature 1 | 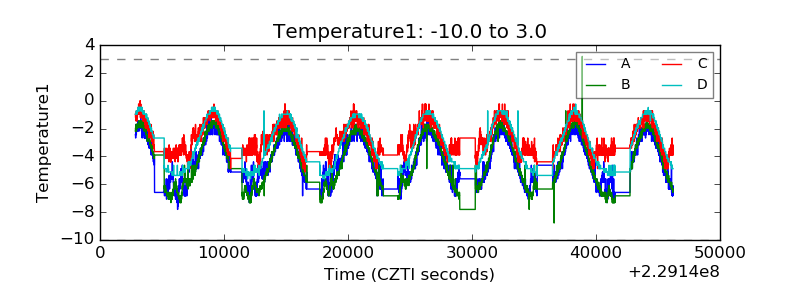 |
| Veto HV Monitor |  |
| Veto LLD | 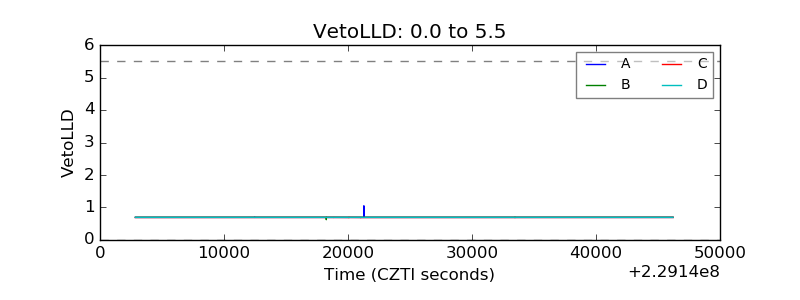 |
| Alpha Counter |  |
| _CPM_Rate | 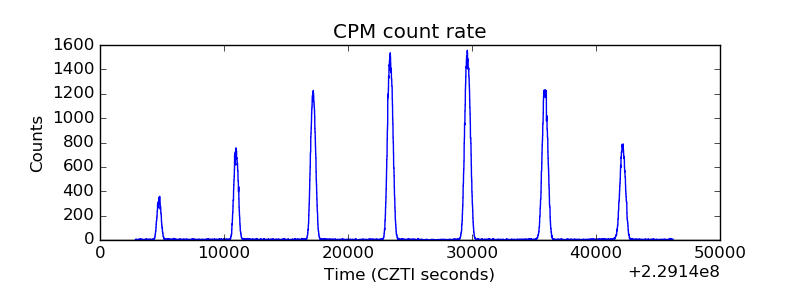 |
| CZT Counter |  |
| +2.5 Volts monitor |  |
| +5 Volts monitor |  |
| _ROLL_ROT | 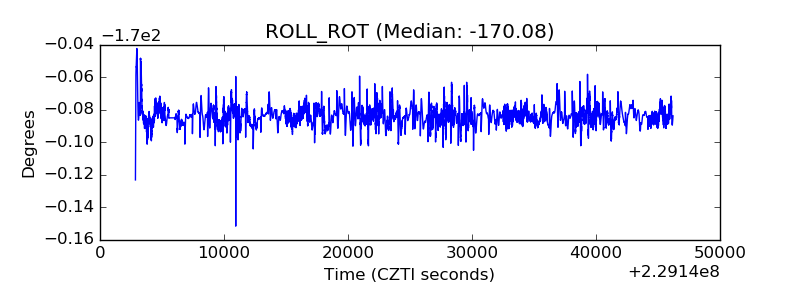 |
| _Roll_DEC |  |
| _Roll_RA |  |
| Veto Counter |  |