| Param | Original file | Final file |
|---|---|---|
| Filename | modeM0/AS1G07_034T01_9000001134cztM0_level2.evt | modeM0/AS1G07_034T01_9000001134cztM0_level2_quad_clean.evt |
| Size (bytes) | 1,063,405,440 | 179,925,120 |
| Size | 1014.1 MB | 171.6 MB |
| Events in quadrant A | 7,424,378 | 1,092,553 |
| Events in quadrant B | 7,321,985 | 1,111,200 |
| Events in quadrant C | 6,913,846 | 1,112,558 |
| Events in quadrant D | 9,501,900 | 1,068,950 |
| Mode SS | |||
|---|---|---|---|
| Quadrant | BADHDUFLAG | Total packets | Discarded packets |
| A | 0 | 314 | 0 |
| B | 0 | 314 | 0 |
| C | 0 | 314 | 0 |
| D | 0 | 314 | 0 |
| Mode M0 | |||
|---|---|---|---|
| Quadrant | BADHDUFLAG | Total packets | Discarded packets |
| A | 0 | 32772 | 0 |
| B | 0 | 32262 | 0 |
| C | 0 | 31596 | 0 |
| D | 0 | 39164 | 0 |
| Mode M9 | |||
|---|---|---|---|
| Quadrant | BADHDUFLAG | Total packets | Discarded packets |
| A | 0 | 15 | 0 |
| B | 0 | 15 | 0 |
| C | 0 | 15 | 0 |
| D | 0 | 15 | 0 |
| Quadrant | Total seconds | Saturated seconds | Saturation percentage |
|---|---|---|---|
| A | 15422 | 131 | 0.849436% |
| B | 15422 | 143 | 0.927247% |
| C | 15422 | 58 | 0.376086% |
| D | 15422 | 548 | 3.553365% |
Noise dominated data is calculated using 1-second bins in cleaned event files. If a bin has >2000 counts, and if more than 50% of those come from <1% of pixels, then it is considered to be noise-dominated and hence unusable.
| Quadrant | # 1 sec bins | Bins with >0 counts | Bins with >2000 counts | High rate bins dominated by noise | Noise dominated (total time) | Noise dominated (detector-on time) | Marked lightcurve |
|---|---|---|---|---|---|---|---|
| A | 16957 | 15427 | 13 | 13 | 0.08% | 0.08% |  |
| B | 16957 | 15427 | 6 | 6 | 0.04% | 0.04% |  |
| C | 16957 | 15427 | 0 | 0 | 0.00% | 0.00% |  |
| D | 16957 | 15427 | 506 | 506 | 2.98% | 3.28% |  |
Top three noisy pixels from each quadrant. If the there are fewer than three noisy pixels in the level2.evt file, extra rows are filled as -1
| Pixel properties | Quadrant properties | ||||||
|---|---|---|---|---|---|---|---|
| Quadrant | DetID | PixID | Counts | Sigma | Mean | Median | Sigma |
| A | 5 | 112 | 265895 | 710.06 | 1820 | 1778 | 372.0 |
| A | 5 | 16 | 68523 | 179.44 | 1820 | 1778 | 372.0 |
| A | 8 | 15 | 57403 | 149.54 | 1820 | 1778 | 372.0 |
| B | 0 | 214 | 67913 | 188.96 | 1834 | 1787 | 350.0 |
| B | 0 | 213 | 44028 | 120.7 | 1834 | 1787 | 350.0 |
| B | 12 | 111 | 37184 | 101.15 | 1834 | 1787 | 350.0 |
| C | 13 | 61 | 13595 | 28.75 | 1770 | 1779 | 410.9 |
| C | 14 | 67 | 9330 | 18.38 | 1770 | 1779 | 410.9 |
| C | 12 | 4 | 4729 | 7.18 | 1770 | 1779 | 410.9 |
| D | 1 | 7 | 2191878 | 4708.32 | 1745 | 1703 | 465.2 |
| D | 1 | 52 | 217780 | 464.51 | 1745 | 1703 | 465.2 |
| D | 2 | 152 | 140183 | 297.7 | 1745 | 1703 | 465.2 |
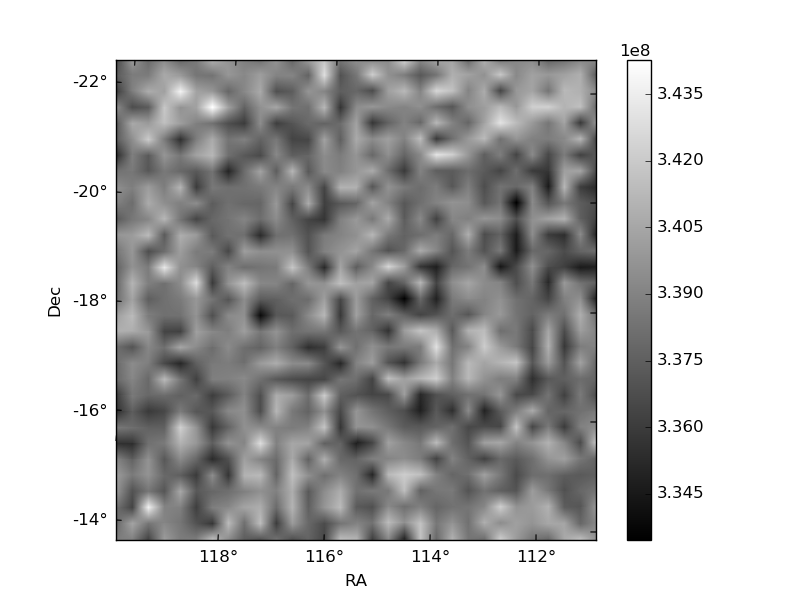
Histogram calculated using DETX and DETY for each event in the final _common_clean file
| Quadrant A |  |
 |
Quadrant B |
|---|---|---|---|
| Quadrant D |  |
 |
Quadrant C |
| Plot type | Count rate plots | Images |
|---|---|---|
| Comparison with Poisson distribution Blue bars denote a histogram of data divided into 1 sec bins. Red curve is a Poisson curve with rate = median count rate of data. |
 |
 |
| Quadrant-wise count rates Data is divided into 100 sec bins |
 |
|
| Module-wise count rates for Quadrant A Data is divided into 100 sec bins |
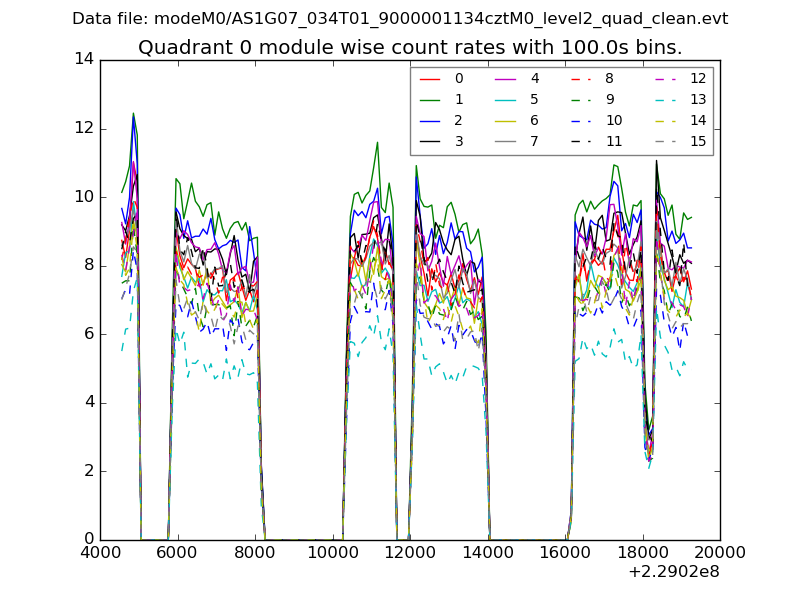 |
 |
| Module-wise count rates for Quadrant B Data is divided into 100 sec bins |
 |
 |
| Module-wise count rates for Quadrant C Data is divided into 100 sec bins |
 |
 |
| Module-wise count rates for Quadrant D Data is divided into 100 sec bins |
 |
 |
| Parameter | Plot |
|---|---|
| CZT HV Monitor |  |
| D_VDD |  |
| Temperature 1 |  |
| Veto HV Monitor |  |
| Veto LLD |  |
| Alpha Counter |  |
| _CPM_Rate |  |
| CZT Counter |  |
| +2.5 Volts monitor |  |
| +5 Volts monitor |  |
| _ROLL_ROT |  |
| _Roll_DEC |  |
| _Roll_RA |  |
| Veto Counter |  |