| Param | Original file | Final file |
|---|---|---|
| Filename | modeM0/AS1C02_041T01_9000001136cztM0_level2.evt | modeM0/AS1C02_041T01_9000001136cztM0_level2_quad_clean.evt |
| Size (bytes) | 6,083,812,800 | 1,101,260,160 |
| Size | 5.7 GB | 1.0 GB |
| Events in quadrant A | 43,477,529 | 6,895,117 |
| Events in quadrant B | 45,739,977 | 6,907,938 |
| Events in quadrant C | 43,317,078 | 6,775,301 |
| Events in quadrant D | 45,634,675 | 6,602,702 |
| Mode M0 | |||
|---|---|---|---|
| Quadrant | BADHDUFLAG | Total packets | Discarded packets |
| A | 0 | 191215 | 0 |
| B | 0 | 195299 | 0 |
| C | 0 | 189651 | 0 |
| D | 0 | 199339 | 0 |
| Mode M9 | |||
|---|---|---|---|
| Quadrant | BADHDUFLAG | Total packets | Discarded packets |
| A | 0 | 122 | 0 |
| B | 0 | 122 | 0 |
| C | 0 | 122 | 0 |
| D | 0 | 122 | 0 |
| Mode SS | |||
|---|---|---|---|
| Quadrant | BADHDUFLAG | Total packets | Discarded packets |
| A | 0 | 1838 | 0 |
| B | 0 | 1838 | 0 |
| C | 0 | 1838 | 0 |
| D | 0 | 1838 | 0 |
| Quadrant | Total seconds | Saturated seconds | Saturation percentage |
|---|---|---|---|
| A | 90086 | 1091 | 1.211065% |
| B | 90085 | 1359 | 1.508575% |
| C | 90086 | 602 | 0.668250% |
| D | 90085 | 1295 | 1.437531% |
Noise dominated data is calculated using 1-second bins in cleaned event files. If a bin has >2000 counts, and if more than 50% of those come from <1% of pixels, then it is considered to be noise-dominated and hence unusable.
| Quadrant | # 1 sec bins | Bins with >0 counts | Bins with >2000 counts | High rate bins dominated by noise | Noise dominated (total time) | Noise dominated (detector-on time) | Marked lightcurve |
|---|---|---|---|---|---|---|---|
| A | 102462 | 90098 | 184 | 184 | 0.18% | 0.20% |  |
| B | 102462 | 90098 | 305 | 305 | 0.30% | 0.34% |  |
| C | 102462 | 90100 | 1 | 1 | 0.00% | 0.00% |  |
| D | 102462 | 90100 | 676 | 676 | 0.66% | 0.75% |  |
Top three noisy pixels from each quadrant. If the there are fewer than three noisy pixels in the level2.evt file, extra rows are filled as -1
| Pixel properties | Quadrant properties | ||||||
|---|---|---|---|---|---|---|---|
| Quadrant | DetID | PixID | Counts | Sigma | Mean | Median | Sigma |
| A | 5 | 16 | 1103161 | 502.49 | 10717 | 10507 | 2174.5 |
| A | 15 | 79 | 829726 | 376.74 | 10717 | 10507 | 2174.5 |
| A | 6 | 16 | 259757 | 114.63 | 10717 | 10507 | 2174.5 |
| B | 10 | 16 | 1366245 | 671.13 | 10722 | 10487 | 2020.1 |
| B | 0 | 214 | 1014025 | 496.78 | 10722 | 10487 | 2020.1 |
| B | 4 | 81 | 443251 | 214.23 | 10722 | 10487 | 2020.1 |
| C | 9 | 68 | 2827697 | 1183.52 | 10313 | 10355 | 2380.5 |
| C | 1 | 16 | 196105 | 78.03 | 10313 | 10355 | 2380.5 |
| C | 13 | 61 | 79457 | 29.03 | 10313 | 10355 | 2380.5 |
| D | 1 | 52 | 2574655 | 935.43 | 10290 | 10064 | 2741.6 |
| D | 13 | 105 | 991558 | 358.0 | 10290 | 10064 | 2741.6 |
| D | 12 | 233 | 990961 | 357.78 | 10290 | 10064 | 2741.6 |
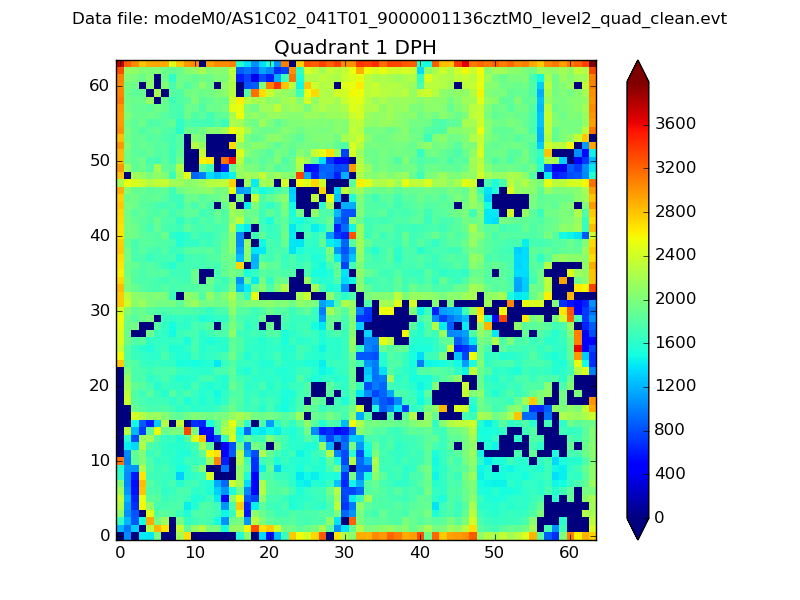
Histogram calculated using DETX and DETY for each event in the final _common_clean file
| Quadrant A |  |
 |
Quadrant B |
|---|---|---|---|
| Quadrant D |  |
 |
Quadrant C |
| Plot type | Count rate plots | Images |
|---|---|---|
| Comparison with Poisson distribution Blue bars denote a histogram of data divided into 1 sec bins. Red curve is a Poisson curve with rate = median count rate of data. |
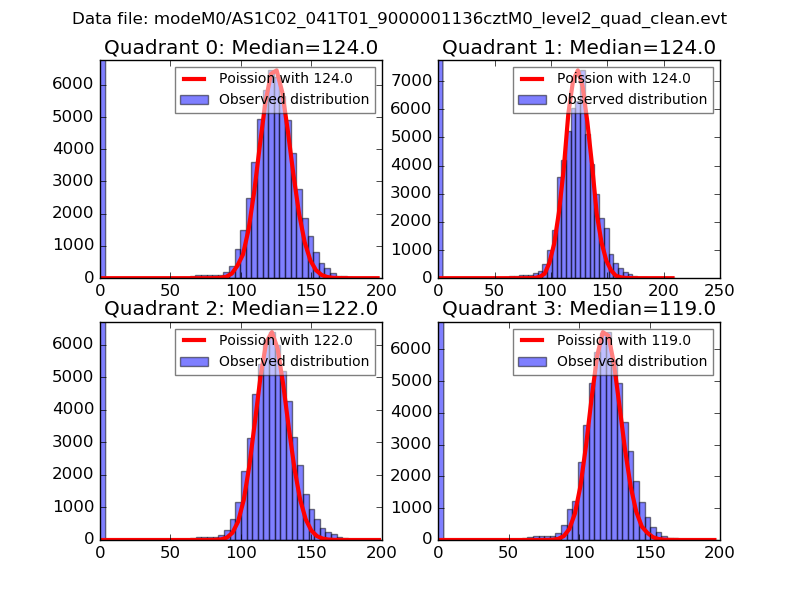 |
 |
| Quadrant-wise count rates Data is divided into 100 sec bins |
 |
|
| Module-wise count rates for Quadrant A Data is divided into 100 sec bins |
 |
 |
| Module-wise count rates for Quadrant B Data is divided into 100 sec bins |
 |
 |
| Module-wise count rates for Quadrant C Data is divided into 100 sec bins |
 |
 |
| Module-wise count rates for Quadrant D Data is divided into 100 sec bins |
 |
 |
| Parameter | Plot |
|---|---|
| CZT HV Monitor |  |
| D_VDD |  |
| Temperature 1 |  |
| Veto HV Monitor |  |
| Veto LLD |  |
| Alpha Counter |  |
| _CPM_Rate |  |
| CZT Counter |  |
| +2.5 Volts monitor |  |
| +5 Volts monitor |  |
| _ROLL_ROT |  |
| _Roll_DEC |  |
| _Roll_RA | 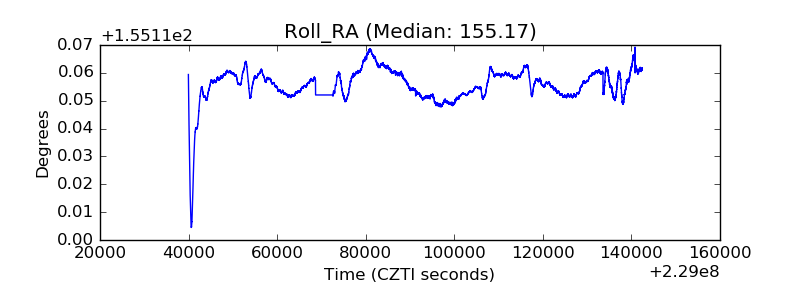 |
| Veto Counter |  |