| Param | Original file | Final file |
|---|---|---|
| Filename | modeM0/AS1A03_103T01_9000001132cztM0_level2.evt | modeM0/AS1A03_103T01_9000001132cztM0_level2_quad_clean.evt |
| Size (bytes) | 2,954,240,640 | 813,582,720 |
| Size | 2.8 GB | 775.9 MB |
| Events in quadrant A | 20,282,000 | 5,517,672 |
| Events in quadrant B | 21,252,568 | 5,584,265 |
| Events in quadrant C | 19,323,378 | 5,450,390 |
| Events in quadrant D | 25,654,390 | 5,087,737 |
| Mode M9 | |||
|---|---|---|---|
| Quadrant | BADHDUFLAG | Total packets | Discarded packets |
| A | 0 | 87 | 0 |
| B | 0 | 87 | 0 |
| C | 0 | 87 | 0 |
| D | 0 | 87 | 0 |
| Mode M0 | |||
|---|---|---|---|
| Quadrant | BADHDUFLAG | Total packets | Discarded packets |
| A | 0 | 90962 | 0 |
| B | 0 | 92816 | 0 |
| C | 0 | 89510 | 0 |
| D | 0 | 108229 | 0 |
| Mode SS | |||
|---|---|---|---|
| Quadrant | BADHDUFLAG | Total packets | Discarded packets |
| A | 0 | 892 | 0 |
| B | 0 | 892 | 0 |
| C | 0 | 892 | 0 |
| D | 0 | 892 | 0 |
| Quadrant | Total seconds | Saturated seconds | Saturation percentage |
|---|---|---|---|
| A | 43773 | 604 | 1.379846% |
| B | 43772 | 642 | 1.466691% |
| C | 43773 | 409 | 0.934366% |
| D | 43773 | 2310 | 5.277226% |
Noise dominated data is calculated using 1-second bins in cleaned event files. If a bin has >2000 counts, and if more than 50% of those come from <1% of pixels, then it is considered to be noise-dominated and hence unusable.
| Quadrant | # 1 sec bins | Bins with >0 counts | Bins with >2000 counts | High rate bins dominated by noise | Noise dominated (total time) | Noise dominated (detector-on time) | Marked lightcurve |
|---|---|---|---|---|---|---|---|
| A | 52238 | 43775 | 83 | 83 | 0.16% | 0.19% |  |
| B | 52238 | 43775 | 75 | 75 | 0.14% | 0.17% |  |
| C | 52238 | 43776 | 0 | 0 | 0.00% | 0.00% | 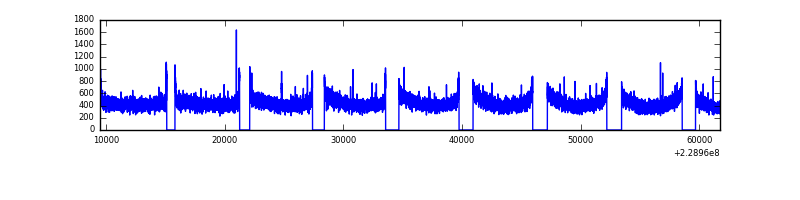 |
| D | 52238 | 43775 | 1774 | 1774 | 3.40% | 4.05% |  |
Top three noisy pixels from each quadrant. If the there are fewer than three noisy pixels in the level2.evt file, extra rows are filled as -1
| Pixel properties | Quadrant properties | ||||||
|---|---|---|---|---|---|---|---|
| Quadrant | DetID | PixID | Counts | Sigma | Mean | Median | Sigma |
| A | 4 | 2 | 373911 | 359.23 | 5131 | 5028 | 1026.9 |
| A | 13 | 170 | 64314 | 57.73 | 5131 | 5028 | 1026.9 |
| A | 8 | 15 | 55237 | 48.9 | 5131 | 5028 | 1026.9 |
| B | 0 | 214 | 462732 | 476.8 | 5147 | 5026 | 960.0 |
| B | 10 | 16 | 364774 | 374.76 | 5147 | 5026 | 960.0 |
| B | 4 | 81 | 181225 | 183.55 | 5147 | 5026 | 960.0 |
| C | 13 | 61 | 37973 | 29.44 | 4942 | 4955 | 1121.4 |
| C | 1 | 0 | 21214 | 14.5 | 4942 | 4955 | 1121.4 |
| C | 8 | 128 | 18475 | 12.06 | 4942 | 4955 | 1121.4 |
| D | 1 | 52 | 5419025 | 4651.37 | 4813 | 4662 | 1164.0 |
| D | 12 | 233 | 782378 | 668.12 | 4813 | 4662 | 1164.0 |
| D | 2 | 152 | 436530 | 371.01 | 4813 | 4662 | 1164.0 |
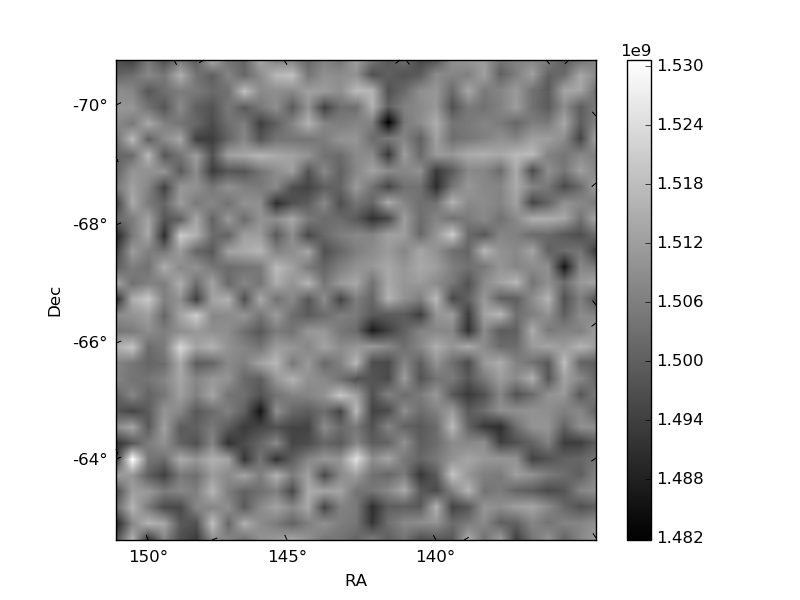
Histogram calculated using DETX and DETY for each event in the final _common_clean file
| Quadrant A |  |
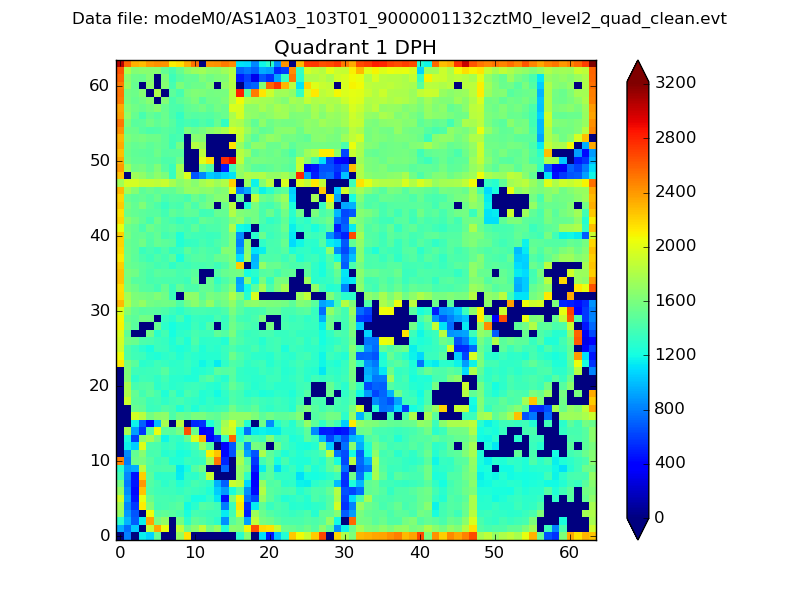 |
Quadrant B |
|---|---|---|---|
| Quadrant D |  |
 |
Quadrant C |
| Plot type | Count rate plots | Images |
|---|---|---|
| Comparison with Poisson distribution Blue bars denote a histogram of data divided into 1 sec bins. Red curve is a Poisson curve with rate = median count rate of data. |
 |
 |
| Quadrant-wise count rates Data is divided into 100 sec bins |
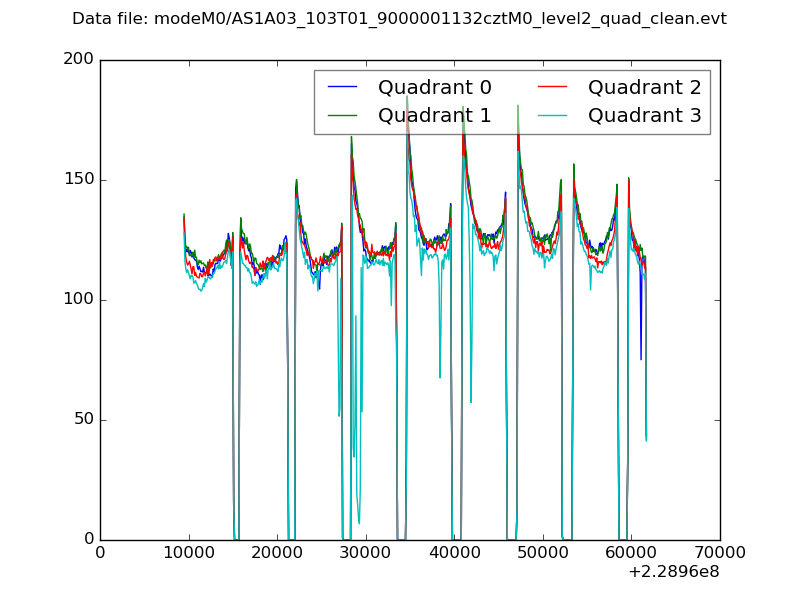 |
|
| Module-wise count rates for Quadrant A Data is divided into 100 sec bins |
 |
 |
| Module-wise count rates for Quadrant B Data is divided into 100 sec bins |
 |
 |
| Module-wise count rates for Quadrant C Data is divided into 100 sec bins |
 |
 |
| Module-wise count rates for Quadrant D Data is divided into 100 sec bins |
 |
 |
| Parameter | Plot |
|---|---|
| CZT HV Monitor |  |
| D_VDD |  |
| Temperature 1 | 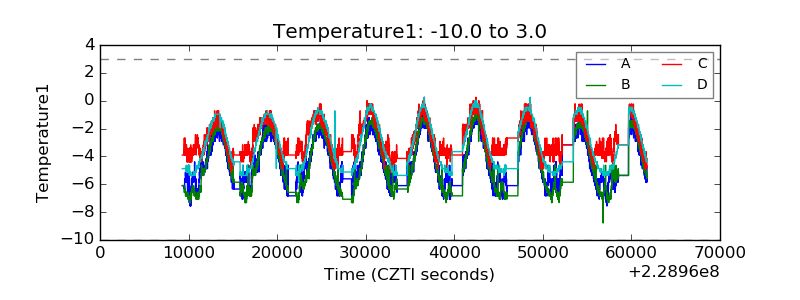 |
| Veto HV Monitor | 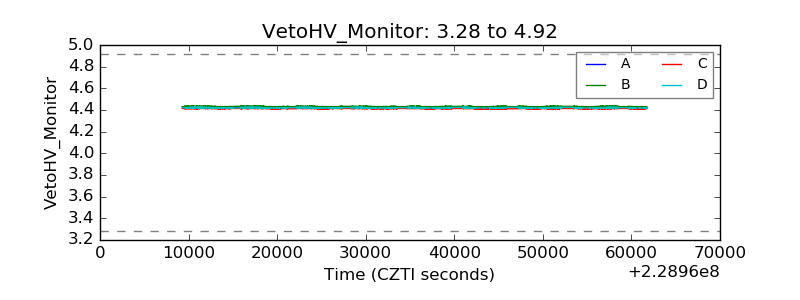 |
| Veto LLD |  |
| Alpha Counter | 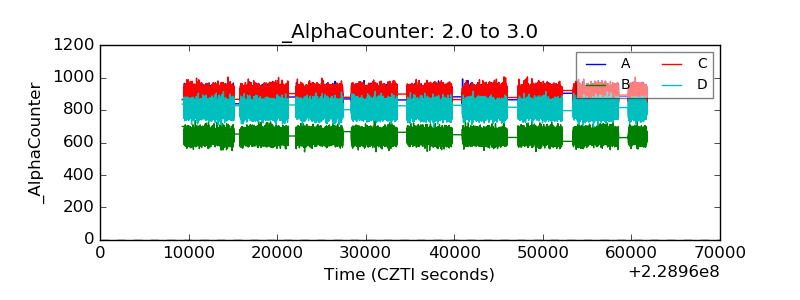 |
| _CPM_Rate |  |
| CZT Counter |  |
| +2.5 Volts monitor | 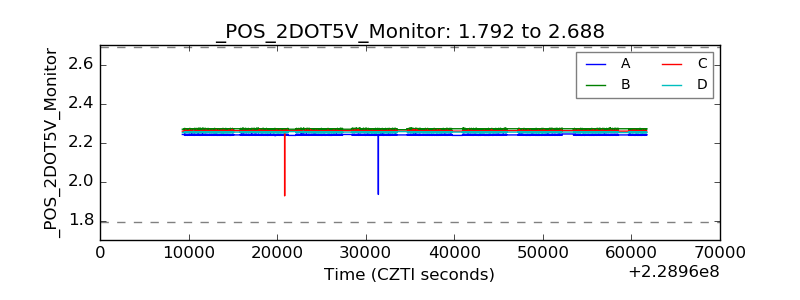 |
| +5 Volts monitor | 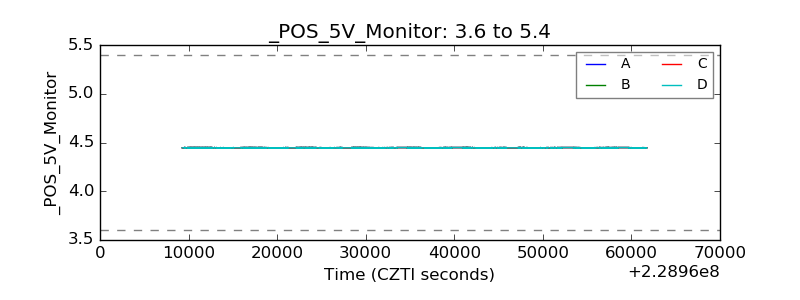 |
| _ROLL_ROT | 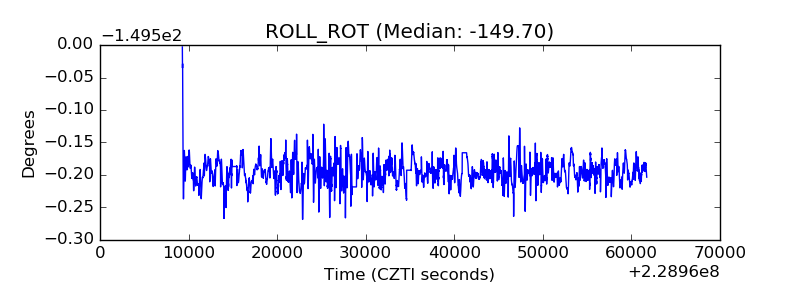 |
| _Roll_DEC |  |
| _Roll_RA | 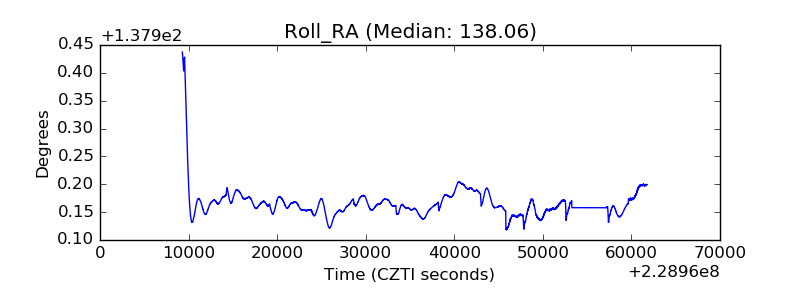 |
| Veto Counter |  |