| Param | Original file | Final file |
|---|---|---|
| Filename | modeM0/AS1A03_036T01_9000001128cztM0_level2.evt | modeM0/AS1A03_036T01_9000001128cztM0_level2_quad_clean.evt |
| Size (bytes) | 3,756,144,960 | 701,838,720 |
| Size | 3.5 GB | 669.3 MB |
| Events in quadrant A | 25,156,335 | 4,444,197 |
| Events in quadrant B | 27,892,446 | 4,435,470 |
| Events in quadrant C | 24,549,910 | 4,403,560 |
| Events in quadrant D | 32,406,299 | 4,164,125 |
| Mode M9 | |||
|---|---|---|---|
| Quadrant | BADHDUFLAG | Total packets | Discarded packets |
| A | 0 | 70 | 0 |
| B | 0 | 70 | 0 |
| C | 0 | 70 | 0 |
| D | 0 | 70 | 0 |
| Mode M0 | |||
|---|---|---|---|
| Quadrant | BADHDUFLAG | Total packets | Discarded packets |
| A | 0 | 113462 | 0 |
| B | 0 | 120393 | 0 |
| C | 0 | 113053 | 0 |
| D | 0 | 135723 | 0 |
| Mode SS | |||
|---|---|---|---|
| Quadrant | BADHDUFLAG | Total packets | Discarded packets |
| A | 0 | 1134 | 0 |
| B | 0 | 1134 | 0 |
| C | 0 | 1134 | 0 |
| D | 0 | 1134 | 0 |
| Quadrant | Total seconds | Saturated seconds | Saturation percentage |
|---|---|---|---|
| A | 55536 | 451 | 0.812086% |
| B | 55535 | 1148 | 2.067165% |
| C | 55536 | 365 | 0.657231% |
| D | 55536 | 2037 | 3.667891% |
Noise dominated data is calculated using 1-second bins in cleaned event files. If a bin has >2000 counts, and if more than 50% of those come from <1% of pixels, then it is considered to be noise-dominated and hence unusable.
| Quadrant | # 1 sec bins | Bins with >0 counts | Bins with >2000 counts | High rate bins dominated by noise | Noise dominated (total time) | Noise dominated (detector-on time) | Marked lightcurve |
|---|---|---|---|---|---|---|---|
| A | 62546 | 55546 | 1 | 1 | 0.00% | 0.00% |  |
| B | 62546 | 55545 | 485 | 485 | 0.78% | 0.87% | 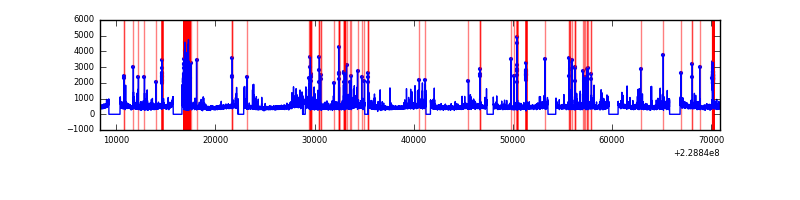 |
| C | 62546 | 55547 | 0 | 0 | 0.00% | 0.00% |  |
| D | 62546 | 55545 | 1348 | 1348 | 2.16% | 2.43% |  |
Top three noisy pixels from each quadrant. If the there are fewer than three noisy pixels in the level2.evt file, extra rows are filled as -1
| Pixel properties | Quadrant properties | ||||||
|---|---|---|---|---|---|---|---|
| Quadrant | DetID | PixID | Counts | Sigma | Mean | Median | Sigma |
| A | 8 | 15 | 220791 | 163.67 | 6460 | 6317 | 1310.4 |
| A | 0 | 226 | 61300 | 41.96 | 6460 | 6317 | 1310.4 |
| A | 13 | 14 | 60041 | 41.0 | 6460 | 6317 | 1310.4 |
| B | 0 | 213 | 1174467 | 968.63 | 6432 | 6275 | 1206.0 |
| B | 10 | 16 | 539864 | 442.44 | 6432 | 6275 | 1206.0 |
| B | 0 | 214 | 535465 | 438.79 | 6432 | 6275 | 1206.0 |
| C | 13 | 61 | 47943 | 28.79 | 6292 | 6311 | 1445.9 |
| C | 3 | 202 | 15636 | 6.45 | 6292 | 6311 | 1445.9 |
| C | 1 | 3 | 15518 | 6.37 | 6292 | 6311 | 1445.9 |
| D | 13 | 122 | 1792044 | 1076.01 | 6156 | 6024 | 1659.9 |
| D | 6 | 6 | 1725544 | 1035.95 | 6156 | 6024 | 1659.9 |
| D | 1 | 52 | 1717921 | 1031.35 | 6156 | 6024 | 1659.9 |
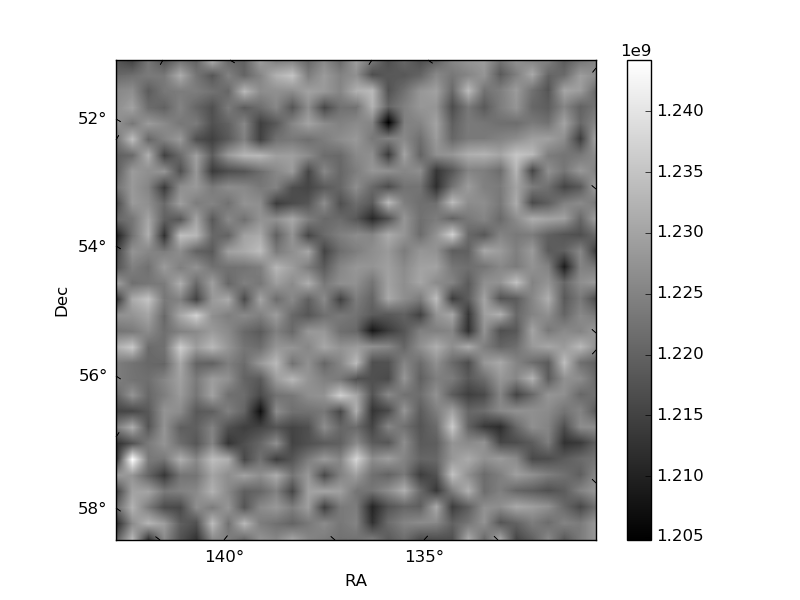
Histogram calculated using DETX and DETY for each event in the final _common_clean file
| Quadrant A |  |
 |
Quadrant B |
|---|---|---|---|
| Quadrant D |  |
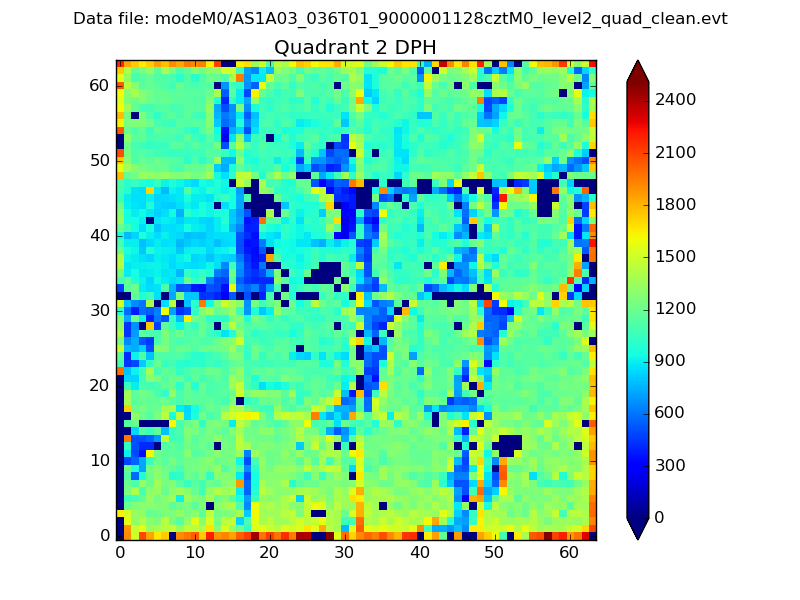 |
Quadrant C |
| Plot type | Count rate plots | Images |
|---|---|---|
| Comparison with Poisson distribution Blue bars denote a histogram of data divided into 1 sec bins. Red curve is a Poisson curve with rate = median count rate of data. |
 |
 |
| Quadrant-wise count rates Data is divided into 100 sec bins |
 |
|
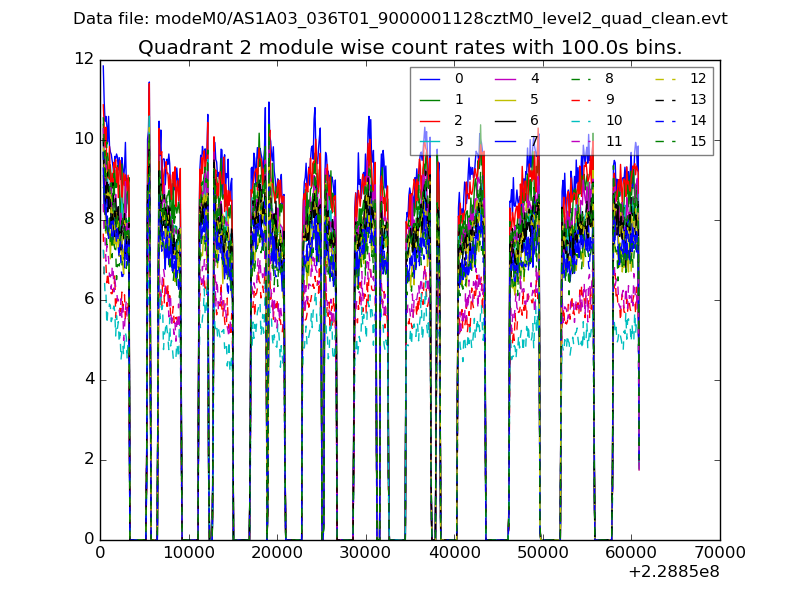
| Module-wise count rates for Quadrant A Data is divided into 100 sec bins |
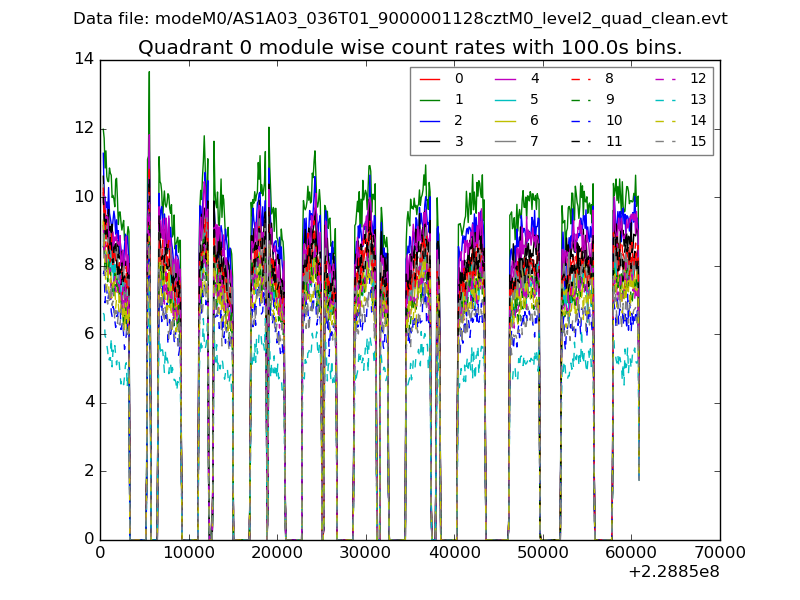 |
 |
| Module-wise count rates for Quadrant B Data is divided into 100 sec bins |
 |
 |
| Module-wise count rates for Quadrant C Data is divided into 100 sec bins |
 |
 |
| Module-wise count rates for Quadrant D Data is divided into 100 sec bins |
 |
 |
| Parameter | Plot |
|---|---|
| CZT HV Monitor | 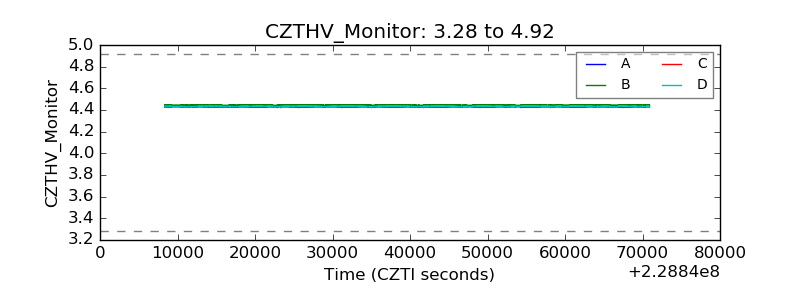 |
| D_VDD |  |
| Temperature 1 |  |
| Veto HV Monitor |  |
| Veto LLD |  |
| Alpha Counter |  |
| _CPM_Rate |  |
| CZT Counter |  |
| +2.5 Volts monitor |  |
| +5 Volts monitor |  |
| _ROLL_ROT | 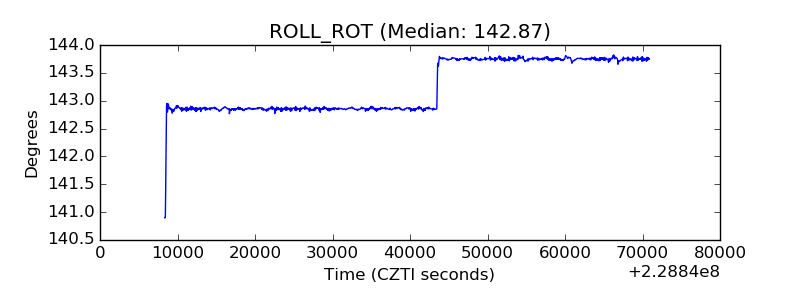 |
| _Roll_DEC |  |
| _Roll_RA |  |
| Veto Counter | 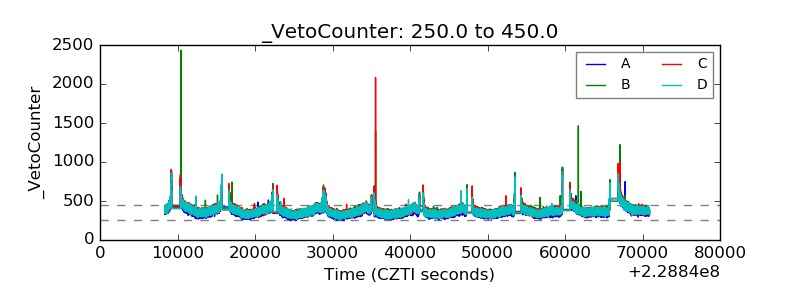 |