| Param | Original file | Final file |
|---|---|---|
| Filename | modeM0/AS1G07_043T01_9000001126cztM0_level2.evt | modeM0/AS1G07_043T01_9000001126cztM0_level2_quad_clean.evt |
| Size (bytes) | 5,360,676,480 | 1,008,904,320 |
| Size | 5.0 GB | 962.2 MB |
| Events in quadrant A | 38,442,383 | 6,237,877 |
| Events in quadrant B | 40,474,742 | 6,322,211 |
| Events in quadrant C | 37,690,568 | 6,384,646 |
| Events in quadrant D | 40,311,636 | 6,100,386 |
| Mode M9 | |||
|---|---|---|---|
| Quadrant | BADHDUFLAG | Total packets | Discarded packets |
| A | 0 | 130 | 0 |
| B | 0 | 130 | 0 |
| C | 0 | 130 | 0 |
| D | 0 | 130 | 0 |
| Mode M0 | |||
|---|---|---|---|
| Quadrant | BADHDUFLAG | Total packets | Discarded packets |
| A | 0 | 168891 | 0 |
| B | 0 | 173645 | 0 |
| C | 0 | 168036 | 0 |
| D | 0 | 175874 | 0 |
| Mode SS | |||
|---|---|---|---|
| Quadrant | BADHDUFLAG | Total packets | Discarded packets |
| A | 0 | 1640 | 0 |
| B | 0 | 1640 | 0 |
| C | 0 | 1640 | 0 |
| D | 0 | 1640 | 0 |
| Quadrant | Total seconds | Saturated seconds | Saturation percentage |
|---|---|---|---|
| A | 80430 | 1006 | 1.250777% |
| B | 80430 | 1594 | 1.981848% |
| C | 80429 | 897 | 1.115269% |
| D | 80430 | 1295 | 1.610096% |
Noise dominated data is calculated using 1-second bins in cleaned event files. If a bin has >2000 counts, and if more than 50% of those come from <1% of pixels, then it is considered to be noise-dominated and hence unusable.
| Quadrant | # 1 sec bins | Bins with >0 counts | Bins with >2000 counts | High rate bins dominated by noise | Noise dominated (total time) | Noise dominated (detector-on time) | Marked lightcurve |
|---|---|---|---|---|---|---|---|
| A | 93375 | 80441 | 16 | 16 | 0.02% | 0.02% |  |
| B | 93375 | 80443 | 415 | 415 | 0.44% | 0.52% | 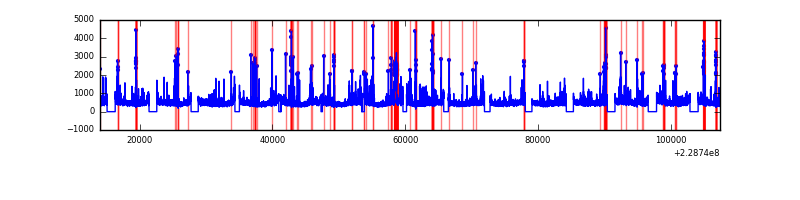 |
| C | 93375 | 80442 | 6 | 6 | 0.01% | 0.01% |  |
| D | 93375 | 80442 | 437 | 437 | 0.47% | 0.54% |  |
Top three noisy pixels from each quadrant. If the there are fewer than three noisy pixels in the level2.evt file, extra rows are filled as -1
| Pixel properties | Quadrant properties | ||||||
|---|---|---|---|---|---|---|---|
| Quadrant | DetID | PixID | Counts | Sigma | Mean | Median | Sigma |
| A | 15 | 79 | 1202358 | 617.1 | 9573 | 9365 | 1933.2 |
| A | 8 | 15 | 285020 | 142.59 | 9573 | 9365 | 1933.2 |
| A | 0 | 226 | 94729 | 44.16 | 9573 | 9365 | 1933.2 |
| B | 10 | 16 | 683169 | 376.25 | 9571 | 9343 | 1790.9 |
| B | 4 | 173 | 651462 | 358.55 | 9571 | 9343 | 1790.9 |
| B | 0 | 214 | 601900 | 330.87 | 9571 | 9343 | 1790.9 |
| C | 1 | 16 | 1202191 | 555.74 | 9353 | 9391 | 2146.3 |
| C | 13 | 61 | 72288 | 29.3 | 9353 | 9391 | 2146.3 |
| C | 12 | 4 | 30220 | 9.7 | 9353 | 9391 | 2146.3 |
| D | 13 | 122 | 1032967 | 452.93 | 9333 | 9055 | 2260.6 |
| D | 1 | 52 | 981960 | 430.37 | 9333 | 9055 | 2260.6 |
| D | 5 | 233 | 682423 | 297.87 | 9333 | 9055 | 2260.6 |
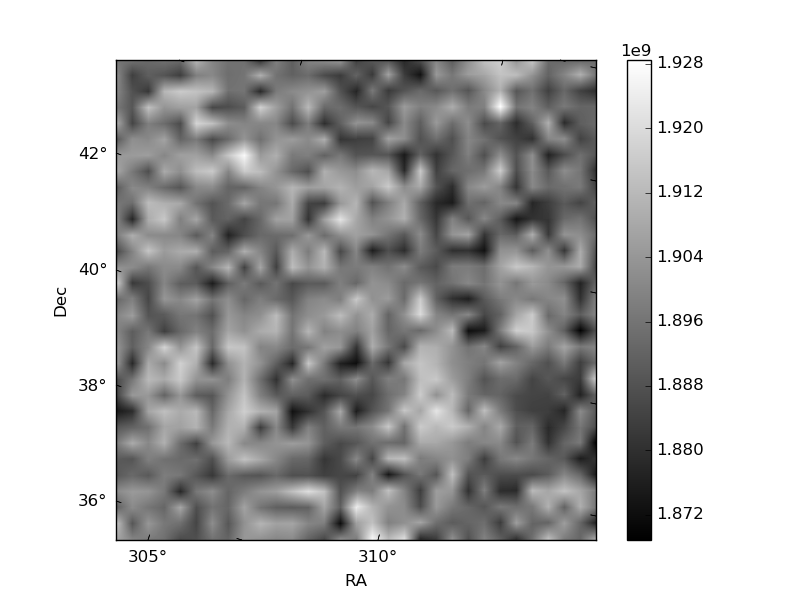
Histogram calculated using DETX and DETY for each event in the final _common_clean file
| Quadrant A |  |
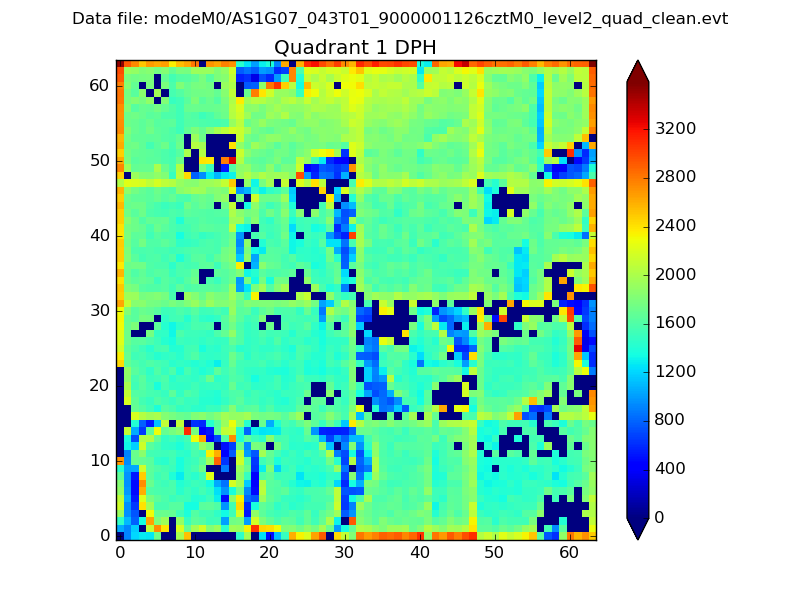 |
Quadrant B |
|---|---|---|---|
| Quadrant D |  |
 |
Quadrant C |
| Plot type | Count rate plots | Images |
|---|---|---|
| Comparison with Poisson distribution Blue bars denote a histogram of data divided into 1 sec bins. Red curve is a Poisson curve with rate = median count rate of data. |
 |
 |
| Quadrant-wise count rates Data is divided into 100 sec bins |
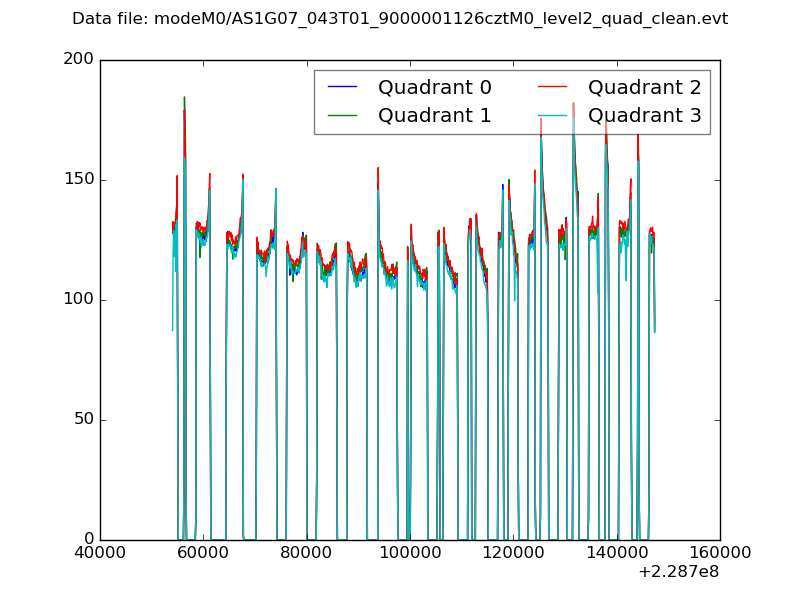 |
|
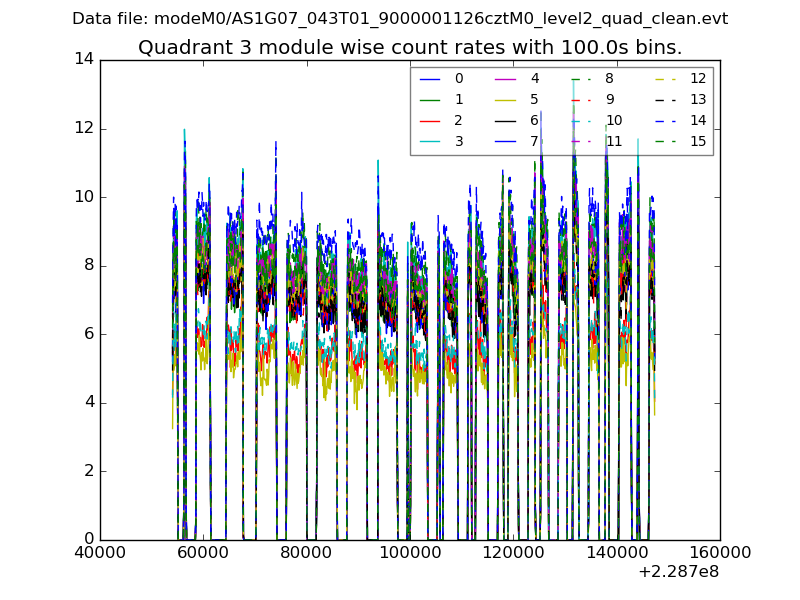
| Module-wise count rates for Quadrant A Data is divided into 100 sec bins |
 |
 |
| Module-wise count rates for Quadrant B Data is divided into 100 sec bins |
 |
 |
| Module-wise count rates for Quadrant C Data is divided into 100 sec bins |
 |
 |
| Module-wise count rates for Quadrant D Data is divided into 100 sec bins |
 |
 |
| Parameter | Plot |
|---|---|
| CZT HV Monitor |  |
| D_VDD |  |
| Temperature 1 |  |
| Veto HV Monitor |  |
| Veto LLD |  |
| Alpha Counter |  |
| _CPM_Rate | 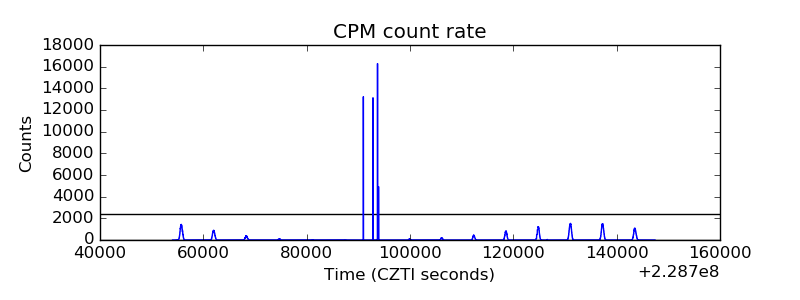 |
| CZT Counter |  |
| +2.5 Volts monitor |  |
| +5 Volts monitor |  |
| _ROLL_ROT |  |
| _Roll_DEC |  |
| _Roll_RA |  |
| Veto Counter |  |