| Param | Original file | Final file |
|---|---|---|
| Filename | modeM0/AS1G06_028T01_9000001122cztM0_level2.evt | modeM0/AS1G06_028T01_9000001122cztM0_level2_quad_clean.evt |
| Size (bytes) | 1,721,082,240 | 331,240,320 |
| Size | 1.6 GB | 315.9 MB |
| Events in quadrant A | 11,712,639 | 2,092,163 |
| Events in quadrant B | 13,832,027 | 2,079,217 |
| Events in quadrant C | 12,107,829 | 2,133,952 |
| Events in quadrant D | 12,808,489 | 2,035,275 |
| Mode SS | |||
|---|---|---|---|
| Quadrant | BADHDUFLAG | Total packets | Discarded packets |
| A | 0 | 502 | 0 |
| B | 0 | 502 | 0 |
| C | 0 | 502 | 0 |
| D | 0 | 502 | 0 |
| Mode M9 | |||
|---|---|---|---|
| Quadrant | BADHDUFLAG | Total packets | Discarded packets |
| A | 0 | 42 | 0 |
| B | 0 | 42 | 0 |
| C | 0 | 42 | 0 |
| D | 0 | 42 | 0 |
| Mode M0 | |||
|---|---|---|---|
| Quadrant | BADHDUFLAG | Total packets | Discarded packets |
| A | 0 | 51131 | 0 |
| B | 0 | 57061 | 0 |
| C | 0 | 52460 | 0 |
| D | 0 | 55423 | 0 |
| Quadrant | Total seconds | Saturated seconds | Saturation percentage |
|---|---|---|---|
| A | 24601 | 330 | 1.341409% |
| B | 24601 | 924 | 3.755945% |
| C | 24601 | 312 | 1.268241% |
| D | 24601 | 390 | 1.585301% |
Noise dominated data is calculated using 1-second bins in cleaned event files. If a bin has >2000 counts, and if more than 50% of those come from <1% of pixels, then it is considered to be noise-dominated and hence unusable.
| Quadrant | # 1 sec bins | Bins with >0 counts | Bins with >2000 counts | High rate bins dominated by noise | Noise dominated (total time) | Noise dominated (detector-on time) | Marked lightcurve |
|---|---|---|---|---|---|---|---|
| A | 28716 | 24606 | 0 | 0 | 0.00% | 0.00% |  |
| B | 28716 | 24606 | 298 | 298 | 1.04% | 1.21% | 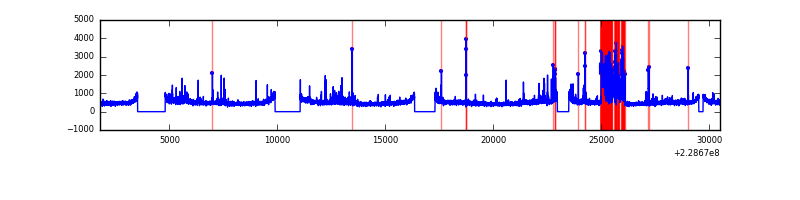 |
| C | 28716 | 24605 | 0 | 0 | 0.00% | 0.00% |  |
| D | 28716 | 24606 | 76 | 76 | 0.26% | 0.31% |  |
Top three noisy pixels from each quadrant. If the there are fewer than three noisy pixels in the level2.evt file, extra rows are filled as -1
| Pixel properties | Quadrant properties | ||||||
|---|---|---|---|---|---|---|---|
| Quadrant | DetID | PixID | Counts | Sigma | Mean | Median | Sigma |
| A | 0 | 226 | 28395 | 41.08 | 3036 | 2975 | 618.7 |
| A | 12 | 194 | 26941 | 38.73 | 3036 | 2975 | 618.7 |
| A | 13 | 254 | 21237 | 29.52 | 3036 | 2975 | 618.7 |
| B | 4 | 81 | 1479223 | 2596.77 | 3023 | 2957 | 568.5 |
| B | 0 | 219 | 175475 | 303.46 | 3023 | 2957 | 568.5 |
| B | 4 | 173 | 170410 | 294.55 | 3023 | 2957 | 568.5 |
| C | 1 | 16 | 528649 | 769.4 | 2969 | 2993 | 683.2 |
| C | 13 | 61 | 22729 | 28.89 | 2969 | 2993 | 683.2 |
| C | 8 | 128 | 7570 | 6.7 | 2969 | 2993 | 683.2 |
| D | 1 | 52 | 823376 | 1042.37 | 2929 | 2879 | 787.1 |
| D | 12 | 233 | 167796 | 209.51 | 2929 | 2879 | 787.1 |
| D | 2 | 152 | 126602 | 157.18 | 2929 | 2879 | 787.1 |
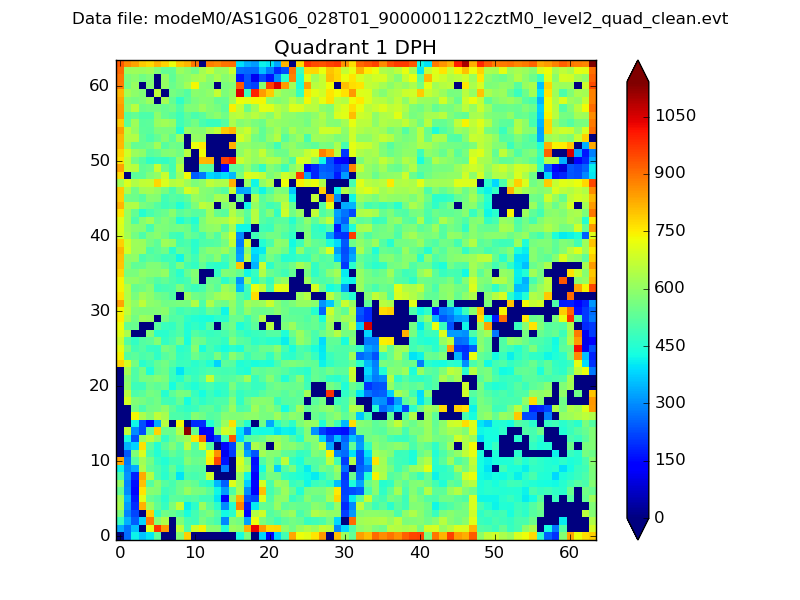
Histogram calculated using DETX and DETY for each event in the final _common_clean file
| Quadrant A |  |
 |
Quadrant B |
|---|---|---|---|
| Quadrant D |  |
 |
Quadrant C |
| Plot type | Count rate plots | Images |
|---|---|---|
| Comparison with Poisson distribution Blue bars denote a histogram of data divided into 1 sec bins. Red curve is a Poisson curve with rate = median count rate of data. |
 |
 |
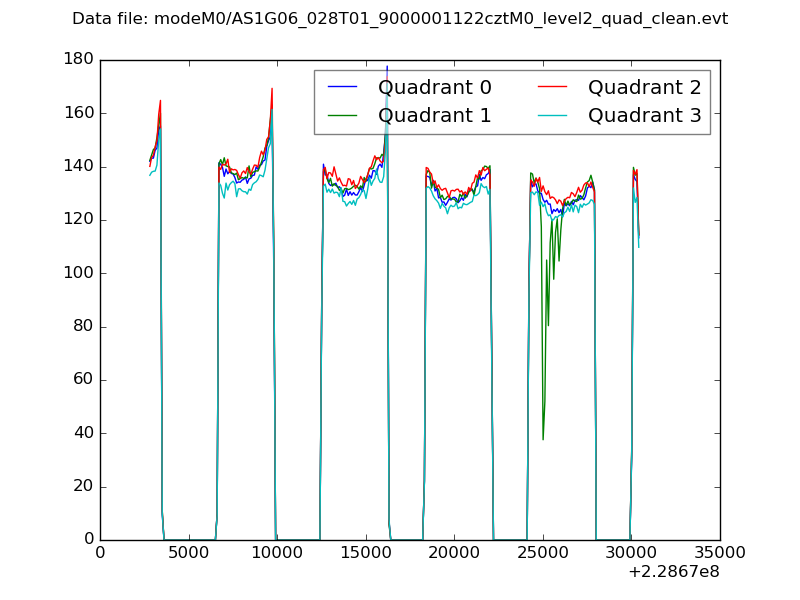
| Quadrant-wise count rates Data is divided into 100 sec bins |
 |
|
| Module-wise count rates for Quadrant A Data is divided into 100 sec bins |
 |
 |
| Module-wise count rates for Quadrant B Data is divided into 100 sec bins |
 |
 |
| Module-wise count rates for Quadrant C Data is divided into 100 sec bins |
 |
 |
| Module-wise count rates for Quadrant D Data is divided into 100 sec bins |
 |
 |
| Parameter | Plot |
|---|---|
| CZT HV Monitor | 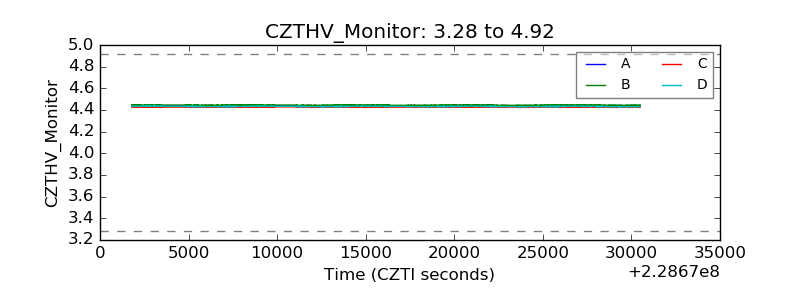 |
| D_VDD |  |
| Temperature 1 |  |
| Veto HV Monitor | 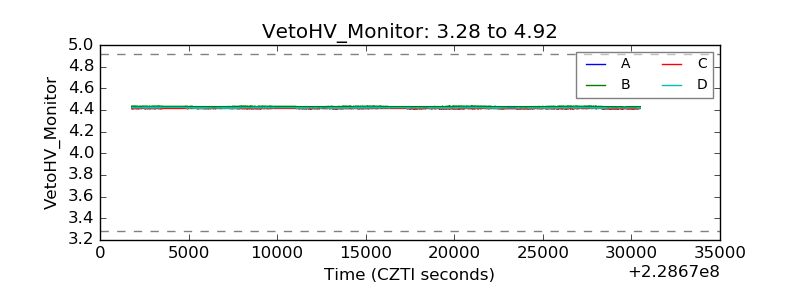 |
| Veto LLD |  |
| Alpha Counter |  |
| _CPM_Rate |  |
| CZT Counter |  |
| +2.5 Volts monitor |  |
| +5 Volts monitor |  |
| _ROLL_ROT |  |
| _Roll_DEC |  |
| _Roll_RA | 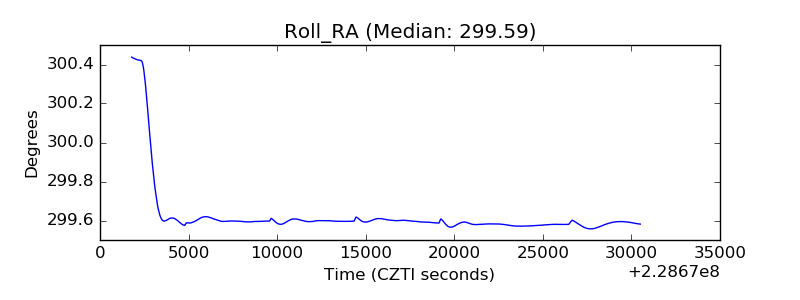 |
| Veto Counter |  |