| Param | Original file | Final file |
|---|---|---|
| Filename | modeM0/AS1A02_178T01_9000001118cztM0_level2.evt | modeM0/AS1A02_178T01_9000001118cztM0_level2_quad_clean.evt |
| Size (bytes) | 5,811,301,440 | 924,733,440 |
| Size | 5.4 GB | 881.9 MB |
| Events in quadrant A | 61,305,609 | 5,234,121 |
| Events in quadrant B | 36,520,349 | 6,062,392 |
| Events in quadrant C | 34,561,658 | 5,929,090 |
| Events in quadrant D | 38,567,394 | 5,655,549 |
| Mode M9 | |||
|---|---|---|---|
| Quadrant | BADHDUFLAG | Total packets | Discarded packets |
| A | 0 | 114 | 0 |
| B | 0 | 114 | 0 |
| C | 0 | 114 | 0 |
| D | 0 | 114 | 0 |
| Mode SS | |||
|---|---|---|---|
| Quadrant | BADHDUFLAG | Total packets | Discarded packets |
| A | 0 | 1526 | 0 |
| B | 0 | 1526 | 0 |
| C | 0 | 1526 | 0 |
| D | 0 | 1526 | 0 |
| Mode M0 | |||
|---|---|---|---|
| Quadrant | BADHDUFLAG | Total packets | Discarded packets |
| A | 0 | 233476 | 0 |
| B | 0 | 158284 | 0 |
| C | 0 | 154379 | 0 |
| D | 0 | 167589 | 0 |
| Quadrant | Total seconds | Saturated seconds | Saturation percentage |
|---|---|---|---|
| A | 74726 | 11900 | 15.924845% |
| B | 74732 | 1121 | 1.500027% |
| C | 74732 | 716 | 0.958090% |
| D | 74730 | 1634 | 2.186538% |
Noise dominated data is calculated using 1-second bins in cleaned event files. If a bin has >2000 counts, and if more than 50% of those come from <1% of pixels, then it is considered to be noise-dominated and hence unusable.
| Quadrant | # 1 sec bins | Bins with >0 counts | Bins with >2000 counts | High rate bins dominated by noise | Noise dominated (total time) | Noise dominated (detector-on time) | Marked lightcurve |
|---|---|---|---|---|---|---|---|
| A | 86186 | 74752 | 10347 | 10347 | 12.01% | 13.84% |  |
| B | 86186 | 74752 | 141 | 141 | 0.16% | 0.19% |  |
| C | 86186 | 74752 | 1 | 1 | 0.00% | 0.00% |  |
| D | 86186 | 74751 | 761 | 761 | 0.88% | 1.02% |  |
Top three noisy pixels from each quadrant. If the there are fewer than three noisy pixels in the level2.evt file, extra rows are filled as -1
| Pixel properties | Quadrant properties | ||||||
|---|---|---|---|---|---|---|---|
| Quadrant | DetID | PixID | Counts | Sigma | Mean | Median | Sigma |
| A | 13 | 170 | 29790423 | 18230.73 | 8123 | 7960 | 1633.6 |
| A | 8 | 15 | 175650 | 102.65 | 8123 | 7960 | 1633.6 |
| A | 0 | 226 | 75731 | 41.48 | 8123 | 7960 | 1633.6 |
| B | 10 | 16 | 811781 | 473.2 | 8999 | 8768 | 1697.0 |
| B | 0 | 214 | 503521 | 291.55 | 8999 | 8768 | 1697.0 |
| B | 12 | 111 | 186306 | 104.62 | 8999 | 8768 | 1697.0 |
| C | 1 | 16 | 416395 | 202.73 | 8748 | 8786 | 2010.6 |
| C | 13 | 61 | 66226 | 28.57 | 8748 | 8786 | 2010.6 |
| C | 8 | 222 | 37337 | 14.2 | 8748 | 8786 | 2010.6 |
| D | 1 | 52 | 1880019 | 823.23 | 8588 | 8400 | 2273.5 |
| D | 12 | 221 | 1436557 | 628.17 | 8588 | 8400 | 2273.5 |
| D | 13 | 122 | 1183183 | 516.72 | 8588 | 8400 | 2273.5 |
Histogram calculated using DETX and DETY for each event in the final _common_clean file
| Quadrant A | 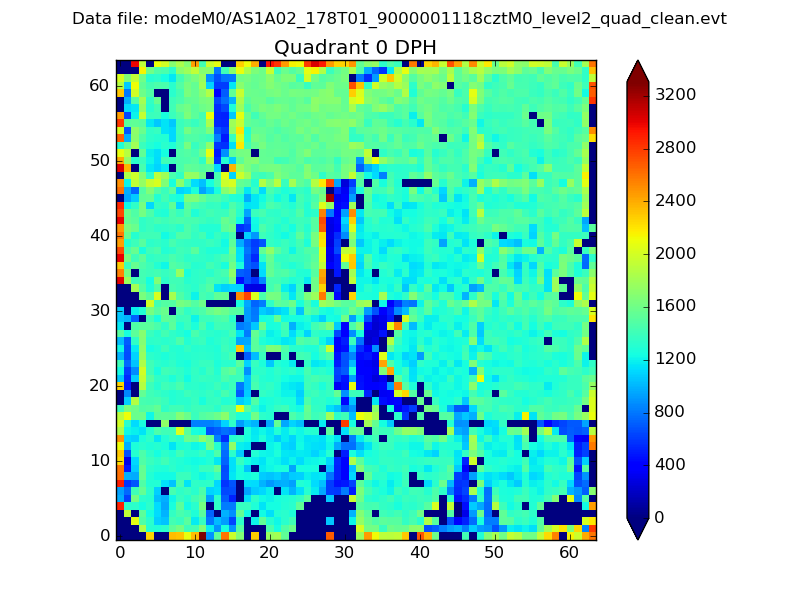 |
 |
Quadrant B |
|---|---|---|---|
| Quadrant D |  |
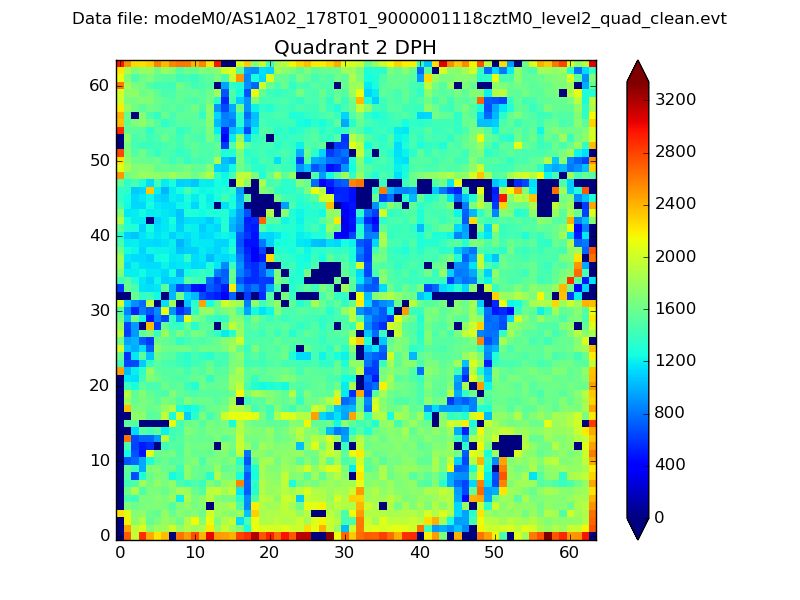 |
Quadrant C |
| Plot type | Count rate plots | Images |
|---|---|---|
| Comparison with Poisson distribution Blue bars denote a histogram of data divided into 1 sec bins. Red curve is a Poisson curve with rate = median count rate of data. |
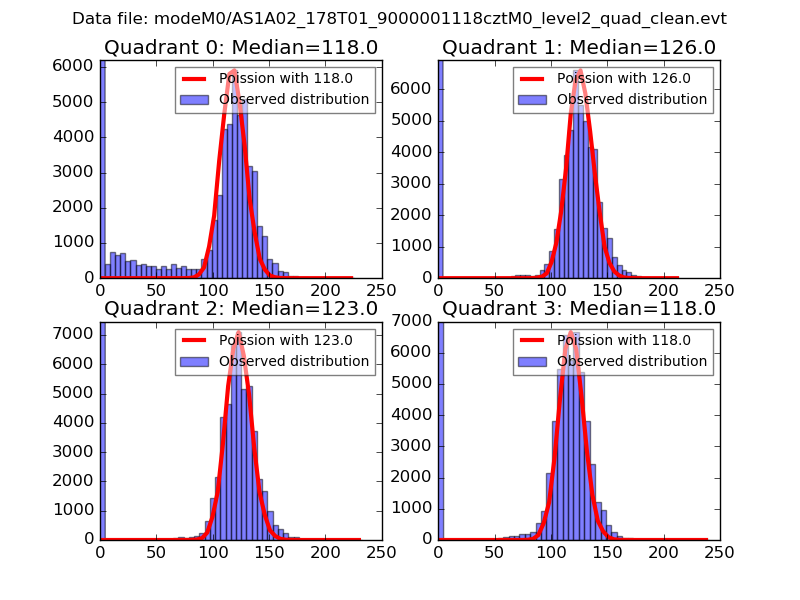 |
 |
| Quadrant-wise count rates Data is divided into 100 sec bins |
 |
|
| Module-wise count rates for Quadrant A Data is divided into 100 sec bins |
 |
 |
| Module-wise count rates for Quadrant B Data is divided into 100 sec bins |
 |
 |
| Module-wise count rates for Quadrant C Data is divided into 100 sec bins |
 |
 |
| Module-wise count rates for Quadrant D Data is divided into 100 sec bins |
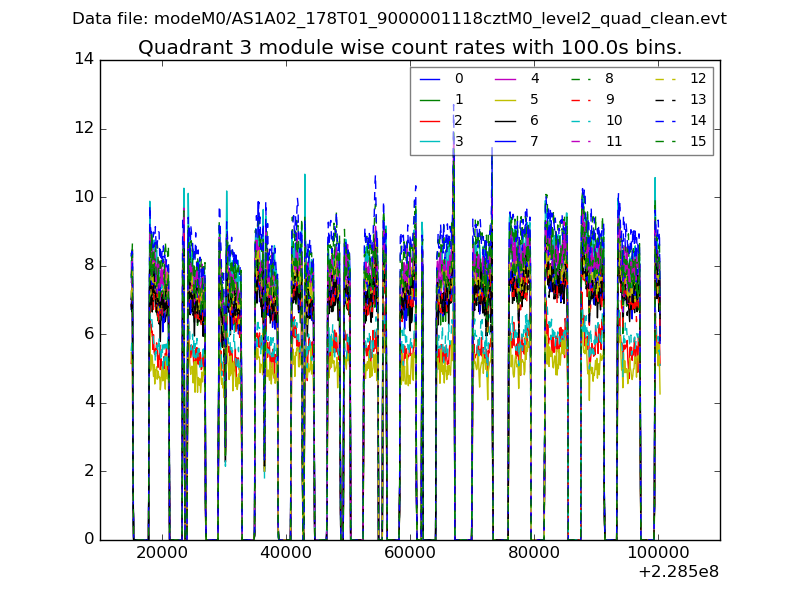 |
 |
| Parameter | Plot |
|---|---|
| CZT HV Monitor | 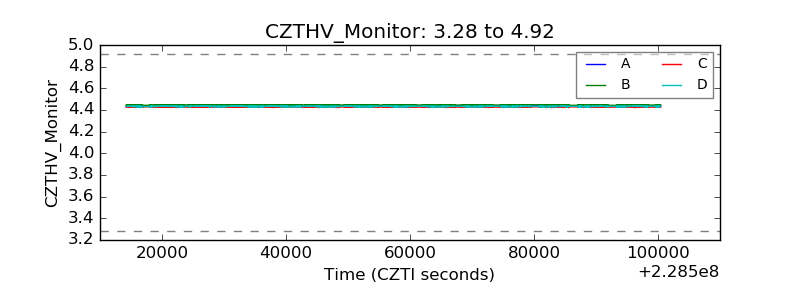 |
| D_VDD |  |
| Temperature 1 | 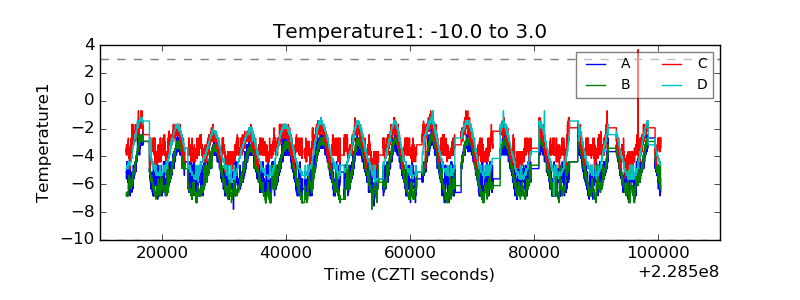 |
| Veto HV Monitor |  |
| Veto LLD | 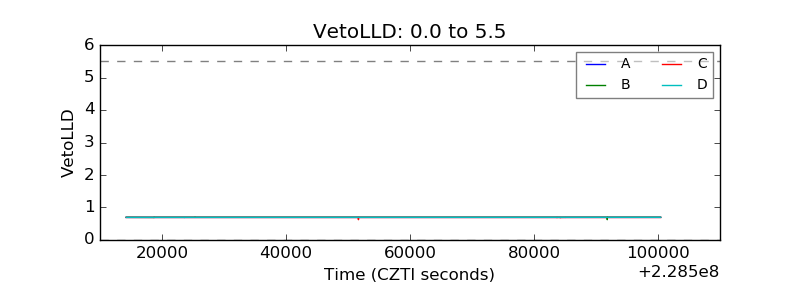 |
| Alpha Counter |  |
| _CPM_Rate |  |
| CZT Counter |  |
| +2.5 Volts monitor |  |
| +5 Volts monitor |  |
| _ROLL_ROT |  |
| _Roll_DEC |  |
| _Roll_RA |  |
| Veto Counter |  |