| Param | Original file | Final file |
|---|---|---|
| Filename | modeM0/AS1G06_033T01_9000001116cztM0_level2.evt | modeM0/AS1G06_033T01_9000001116cztM0_level2_quad_clean.evt |
| Size (bytes) | 5,556,885,120 | 998,193,600 |
| Size | 5.2 GB | 952.0 MB |
| Events in quadrant A | 40,789,911 | 6,181,380 |
| Events in quadrant B | 40,463,238 | 6,258,076 |
| Events in quadrant C | 38,018,850 | 6,308,420 |
| Events in quadrant D | 43,613,325 | 5,992,635 |
| Mode M9 | |||
|---|---|---|---|
| Quadrant | BADHDUFLAG | Total packets | Discarded packets |
| A | 0 | 130 | 0 |
| B | 0 | 130 | 0 |
| C | 0 | 130 | 0 |
| D | 0 | 130 | 0 |
| Mode M0 | |||
|---|---|---|---|
| Quadrant | BADHDUFLAG | Total packets | Discarded packets |
| A | 0 | 173212 | 0 |
| B | 0 | 171780 | 0 |
| C | 0 | 165805 | 0 |
| D | 0 | 183666 | 0 |
| Mode SS | |||
|---|---|---|---|
| Quadrant | BADHDUFLAG | Total packets | Discarded packets |
| A | 0 | 1628 | 0 |
| B | 0 | 1628 | 0 |
| C | 0 | 1628 | 0 |
| D | 0 | 1628 | 0 |
| Quadrant | Total seconds | Saturated seconds | Saturation percentage |
|---|---|---|---|
| A | 80149 | 1034 | 1.290097% |
| B | 80149 | 1201 | 1.498459% |
| C | 80149 | 605 | 0.754844% |
| D | 80149 | 1358 | 1.694344% |
Noise dominated data is calculated using 1-second bins in cleaned event files. If a bin has >2000 counts, and if more than 50% of those come from <1% of pixels, then it is considered to be noise-dominated and hence unusable.
| Quadrant | # 1 sec bins | Bins with >0 counts | Bins with >2000 counts | High rate bins dominated by noise | Noise dominated (total time) | Noise dominated (detector-on time) | Marked lightcurve |
|---|---|---|---|---|---|---|---|
| A | 93049 | 80159 | 12 | 12 | 0.01% | 0.01% |  |
| B | 93049 | 80159 | 67 | 67 | 0.07% | 0.08% |  |
| C | 93049 | 80158 | 17 | 17 | 0.02% | 0.02% |  |
| D | 93049 | 80161 | 634 | 634 | 0.68% | 0.79% | 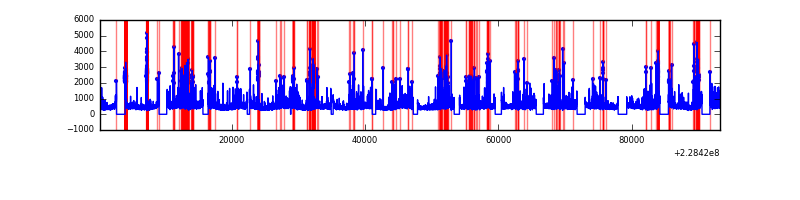 |
Top three noisy pixels from each quadrant. If the there are fewer than three noisy pixels in the level2.evt file, extra rows are filled as -1
| Pixel properties | Quadrant properties | ||||||
|---|---|---|---|---|---|---|---|
| Quadrant | DetID | PixID | Counts | Sigma | Mean | Median | Sigma |
| A | 8 | 15 | 2399577 | 1193.27 | 9886 | 9695 | 2002.8 |
| A | 15 | 79 | 241588 | 115.78 | 9886 | 9695 | 2002.8 |
| A | 0 | 226 | 93026 | 41.61 | 9886 | 9695 | 2002.8 |
| B | 0 | 214 | 679812 | 357.81 | 9938 | 9738 | 1872.7 |
| B | 10 | 16 | 414956 | 216.38 | 9938 | 9738 | 1872.7 |
| B | 11 | 51 | 300023 | 155.01 | 9938 | 9738 | 1872.7 |
| C | 12 | 4 | 131145 | 54.05 | 9691 | 9754 | 2246.1 |
| C | 1 | 16 | 96190 | 38.48 | 9691 | 9754 | 2246.1 |
| C | 13 | 61 | 74323 | 28.75 | 9691 | 9754 | 2246.1 |
| D | 1 | 52 | 3241807 | 1297.69 | 9603 | 9393 | 2490.9 |
| D | 5 | 233 | 1393673 | 555.73 | 9603 | 9393 | 2490.9 |
| D | 2 | 152 | 990391 | 393.83 | 9603 | 9393 | 2490.9 |
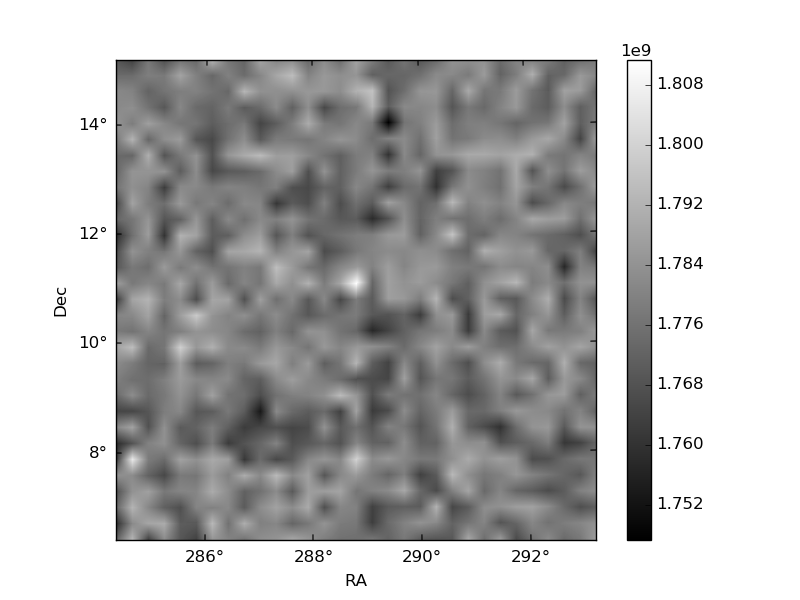
Histogram calculated using DETX and DETY for each event in the final _common_clean file
| Quadrant A |  |
 |
Quadrant B |
|---|---|---|---|
| Quadrant D | 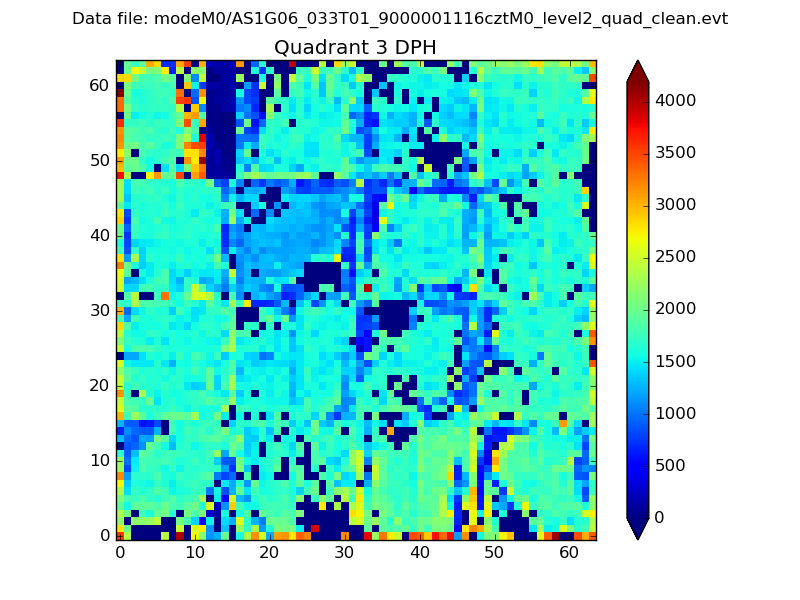 |
 |
Quadrant C |
| Plot type | Count rate plots | Images |
|---|---|---|
| Comparison with Poisson distribution Blue bars denote a histogram of data divided into 1 sec bins. Red curve is a Poisson curve with rate = median count rate of data. |
 |
 |
| Quadrant-wise count rates Data is divided into 100 sec bins |
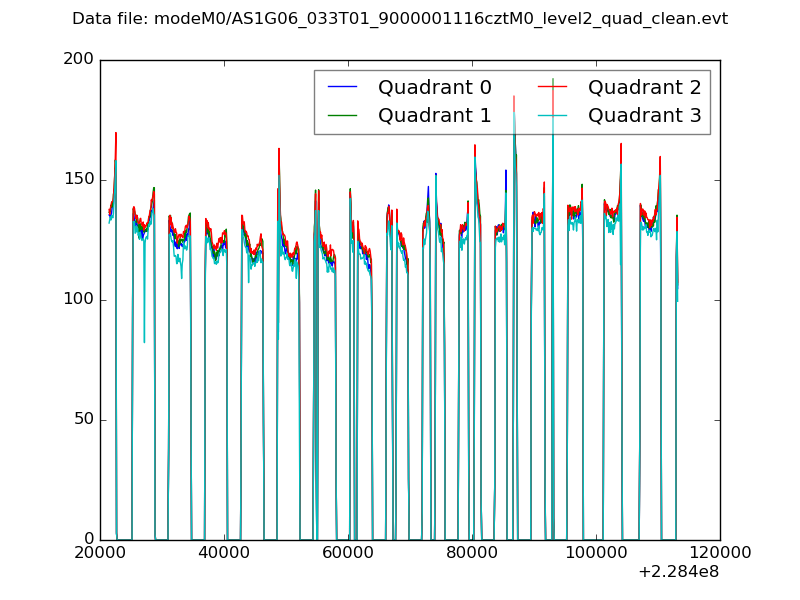 |
|
| Module-wise count rates for Quadrant A Data is divided into 100 sec bins |
 |
 |
| Module-wise count rates for Quadrant B Data is divided into 100 sec bins |
 |
 |
| Module-wise count rates for Quadrant C Data is divided into 100 sec bins |
 |
 |
| Module-wise count rates for Quadrant D Data is divided into 100 sec bins |
 |
 |
| Parameter | Plot |
|---|---|
| CZT HV Monitor | 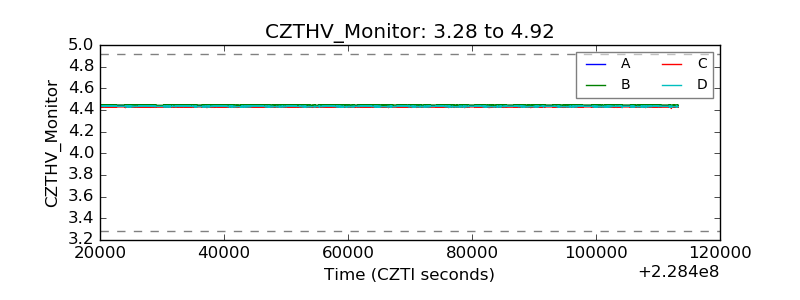 |
| D_VDD |  |
| Temperature 1 |  |
| Veto HV Monitor |  |
| Veto LLD |  |
| Alpha Counter | 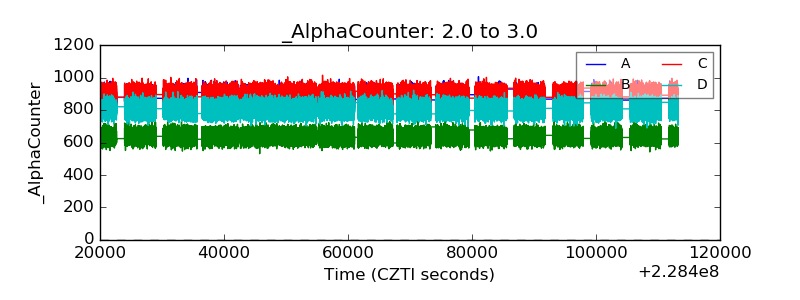 |
| _CPM_Rate |  |
| CZT Counter | 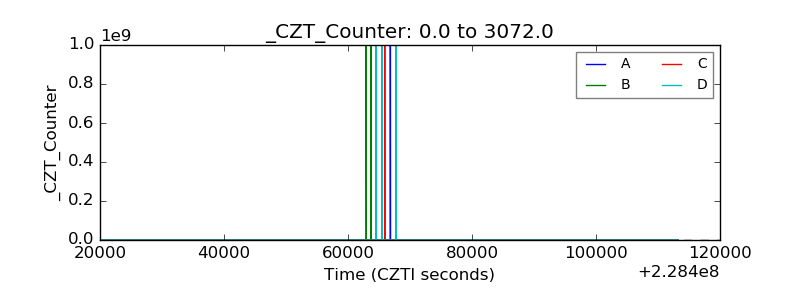 |
| +2.5 Volts monitor |  |
| +5 Volts monitor |  |
| _ROLL_ROT |  |
| _Roll_DEC |  |
| _Roll_RA | 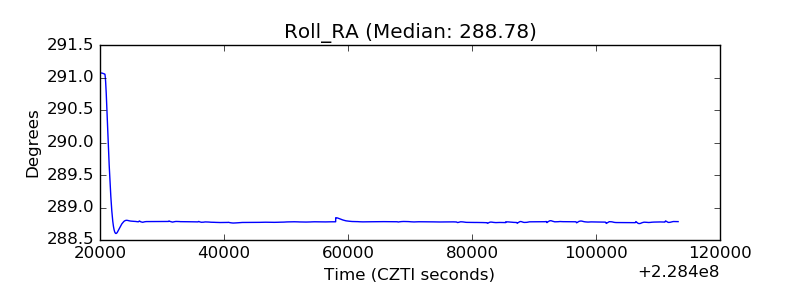 |
| Veto Counter |  |