| Param | Original file | Final file |
|---|---|---|
| Filename | modeM0/AS1G06_168T16_9000001112cztM0_level2.evt | modeM0/AS1G06_168T16_9000001112cztM0_level2_quad_clean.evt |
| Size (bytes) | 505,048,320 | 89,838,720 |
| Size | 481.7 MB | 85.7 MB |
| Events in quadrant A | 3,326,281 | 569,729 |
| Events in quadrant B | 3,401,305 | 583,218 |
| Events in quadrant C | 3,005,484 | 582,852 |
| Events in quadrant D | 5,118,601 | 528,985 |
| Mode SS | |||
|---|---|---|---|
| Quadrant | BADHDUFLAG | Total packets | Discarded packets |
| A | 0 | 130 | 0 |
| B | 0 | 130 | 0 |
| C | 0 | 130 | 0 |
| D | 0 | 130 | 0 |
| Mode M0 | |||
|---|---|---|---|
| Quadrant | BADHDUFLAG | Total packets | Discarded packets |
| A | 0 | 14422 | 0 |
| B | 0 | 14557 | 0 |
| C | 0 | 13447 | 0 |
| D | 0 | 19798 | 0 |
| Quadrant | Total seconds | Saturated seconds | Saturation percentage |
|---|---|---|---|
| A | 6535 | 82 | 1.254782% |
| B | 6535 | 176 | 2.693191% |
| C | 6535 | 20 | 0.306044% |
| D | 6535 | 670 | 10.252487% |
Noise dominated data is calculated using 1-second bins in cleaned event files. If a bin has >2000 counts, and if more than 50% of those come from <1% of pixels, then it is considered to be noise-dominated and hence unusable.
| Quadrant | # 1 sec bins | Bins with >0 counts | Bins with >2000 counts | High rate bins dominated by noise | Noise dominated (total time) | Noise dominated (detector-on time) | Marked lightcurve |
|---|---|---|---|---|---|---|---|
| A | 6580 | 6536 | 17 | 17 | 0.26% | 0.26% |  |
| B | 6580 | 6536 | 61 | 61 | 0.93% | 0.93% |  |
| C | 6580 | 6536 | 0 | 0 | 0.00% | 0.00% |  |
| D | 6580 | 6536 | 522 | 522 | 7.93% | 7.99% |  |
Top three noisy pixels from each quadrant. If the there are fewer than three noisy pixels in the level2.evt file, extra rows are filled as -1
| Pixel properties | Quadrant properties | ||||||
|---|---|---|---|---|---|---|---|
| Quadrant | DetID | PixID | Counts | Sigma | Mean | Median | Sigma |
| A | 4 | 2 | 422077 | 2756.06 | 750 | 732 | 152.9 |
| A | 13 | 251 | 8880 | 53.3 | 750 | 732 | 152.9 |
| A | 15 | 234 | 8549 | 51.13 | 750 | 732 | 152.9 |
| B | 4 | 239 | 219514 | 1500.66 | 757 | 735 | 145.8 |
| B | 11 | 51 | 79635 | 541.19 | 757 | 735 | 145.8 |
| B | 4 | 81 | 54558 | 369.18 | 757 | 735 | 145.8 |
| C | 1 | 16 | 78792 | 454.28 | 743 | 745 | 171.8 |
| C | 8 | 128 | 12866 | 70.55 | 743 | 745 | 171.8 |
| C | 8 | 112 | 6633 | 34.27 | 743 | 745 | 171.8 |
| D | 1 | 52 | 1535439 | 8679.18 | 700 | 681 | 176.8 |
| D | 4 | 95 | 622807 | 3518.17 | 700 | 681 | 176.8 |
| D | 1 | 83 | 177550 | 1000.21 | 700 | 681 | 176.8 |
Histogram calculated using DETX and DETY for each event in the final _common_clean file
| Quadrant A |  |
 |
Quadrant B |
|---|---|---|---|
| Quadrant D | 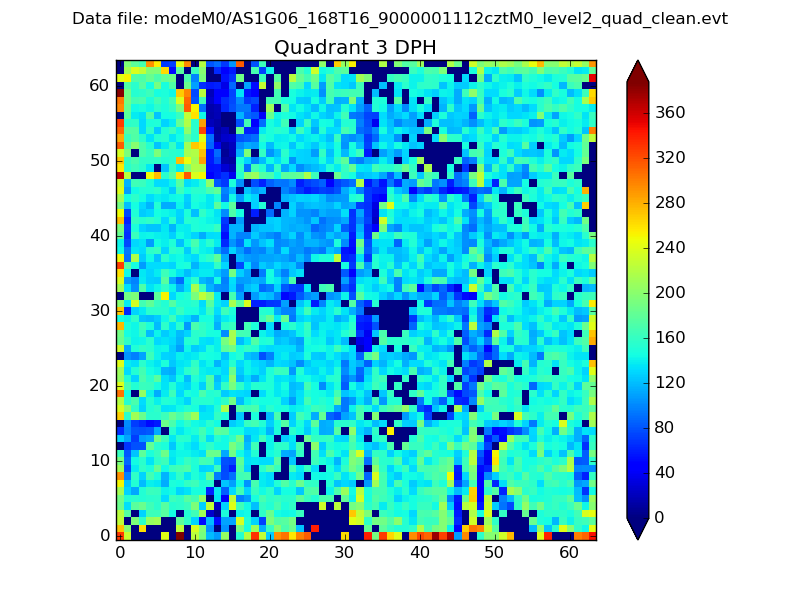 |
 |
Quadrant C |
| Plot type | Count rate plots | Images |
|---|---|---|
| Comparison with Poisson distribution Blue bars denote a histogram of data divided into 1 sec bins. Red curve is a Poisson curve with rate = median count rate of data. |
 |
 |
| Quadrant-wise count rates Data is divided into 100 sec bins |
 |
|
| Module-wise count rates for Quadrant A Data is divided into 100 sec bins |
 |
 |
| Module-wise count rates for Quadrant B Data is divided into 100 sec bins |
 |
 |
| Module-wise count rates for Quadrant C Data is divided into 100 sec bins |
 |
 |
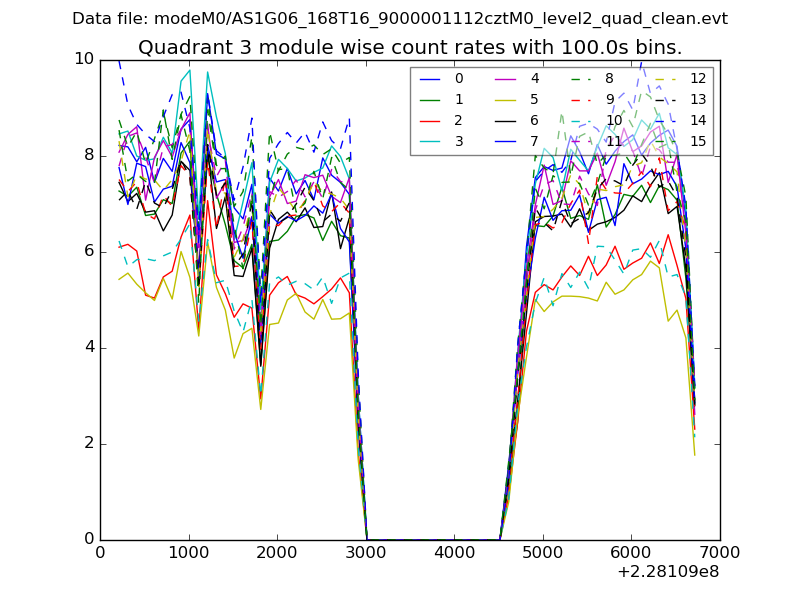
| Module-wise count rates for Quadrant D Data is divided into 100 sec bins |
 |
 |
| Parameter | Plot |
|---|---|
| CZT HV Monitor |  |
| D_VDD | 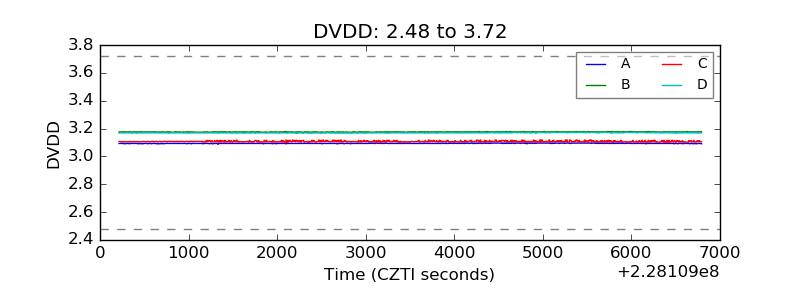 |
| Temperature 1 | 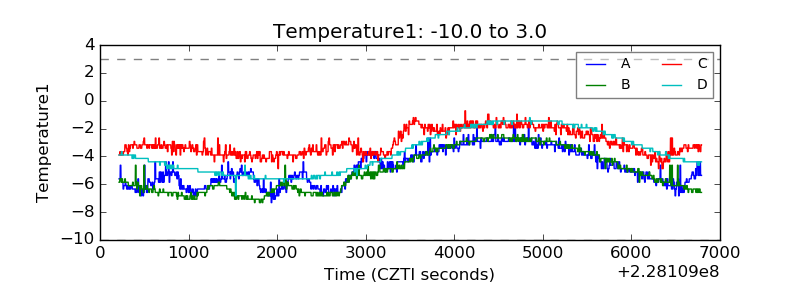 |
| Veto HV Monitor | 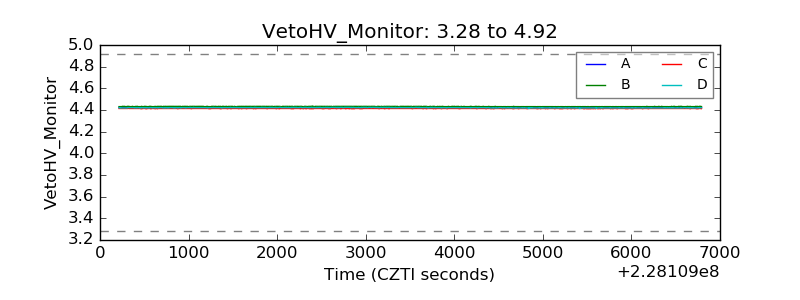 |
| Veto LLD |  |
| Alpha Counter |  |
| _CPM_Rate |  |
| CZT Counter |  |
| +2.5 Volts monitor | 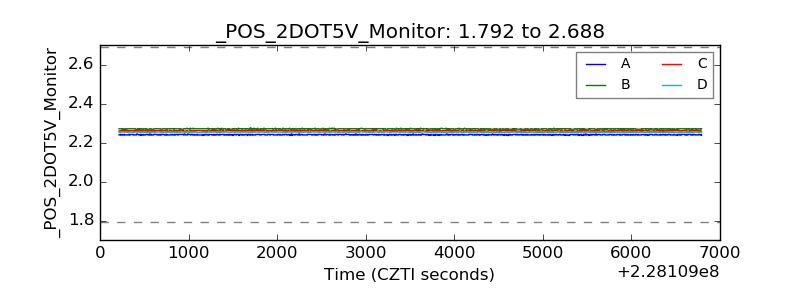 |
| +5 Volts monitor |  |
| _ROLL_ROT |  |
| _Roll_DEC |  |
| _Roll_RA | 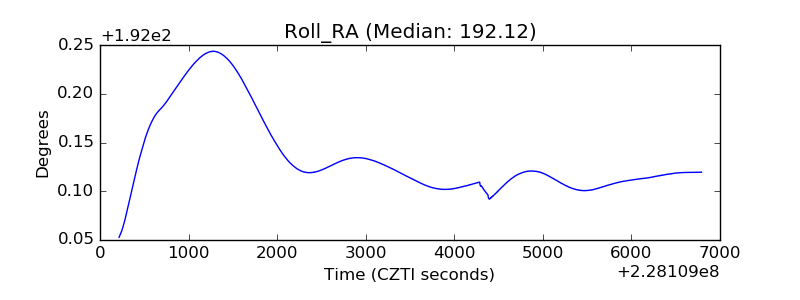 |
| Veto Counter |  |