| Param | Original file | Final file |
|---|---|---|
| Filename | modeM0/AS1G06_168T15_9000001110cztM0_level2.evt | modeM0/AS1G06_168T15_9000001110cztM0_level2_quad_clean.evt |
| Size (bytes) | 768,456,000 | 139,086,720 |
| Size | 732.9 MB | 132.6 MB |
| Events in quadrant A | 5,505,611 | 850,002 |
| Events in quadrant B | 5,293,044 | 879,321 |
| Events in quadrant C | 5,075,138 | 876,879 |
| Events in quadrant D | 6,633,985 | 824,996 |
| Mode SS | |||
|---|---|---|---|
| Quadrant | BADHDUFLAG | Total packets | Discarded packets |
| A | 0 | 230 | 0 |
| B | 0 | 230 | 0 |
| C | 0 | 230 | 0 |
| D | 0 | 230 | 0 |
| Mode M0 | |||
|---|---|---|---|
| Quadrant | BADHDUFLAG | Total packets | Discarded packets |
| A | 0 | 24562 | 0 |
| B | 0 | 23629 | 0 |
| C | 0 | 23202 | 0 |
| D | 0 | 27814 | 0 |
| Mode M9 | |||
|---|---|---|---|
| Quadrant | BADHDUFLAG | Total packets | Discarded packets |
| A | 0 | 12 | 0 |
| B | 0 | 12 | 0 |
| C | 0 | 12 | 0 |
| D | 0 | 12 | 0 |
| Quadrant | Total seconds | Saturated seconds | Saturation percentage |
|---|---|---|---|
| A | 11293 | 289 | 2.559107% |
| B | 11293 | 110 | 0.974055% |
| C | 11293 | 46 | 0.407332% |
| D | 11291 | 275 | 2.435568% |
Noise dominated data is calculated using 1-second bins in cleaned event files. If a bin has >2000 counts, and if more than 50% of those come from <1% of pixels, then it is considered to be noise-dominated and hence unusable.
| Quadrant | # 1 sec bins | Bins with >0 counts | Bins with >2000 counts | High rate bins dominated by noise | Noise dominated (total time) | Noise dominated (detector-on time) | Marked lightcurve |
|---|---|---|---|---|---|---|---|
| A | 12403 | 11296 | 160 | 160 | 1.29% | 1.42% |  |
| B | 12403 | 11296 | 9 | 9 | 0.07% | 0.08% |  |
| C | 12403 | 11296 | 0 | 0 | 0.00% | 0.00% |  |
| D | 12403 | 11296 | 204 | 204 | 1.64% | 1.81% |  |
Top three noisy pixels from each quadrant. If the there are fewer than three noisy pixels in the level2.evt file, extra rows are filled as -1
| Pixel properties | Quadrant properties | ||||||
|---|---|---|---|---|---|---|---|
| Quadrant | DetID | PixID | Counts | Sigma | Mean | Median | Sigma |
| A | 4 | 2 | 544800 | 2072.32 | 1285 | 1254 | 262.3 |
| A | 0 | 226 | 11862 | 40.44 | 1285 | 1254 | 262.3 |
| A | 12 | 194 | 11312 | 38.35 | 1285 | 1254 | 262.3 |
| B | 5 | 250 | 99142 | 387.76 | 1307 | 1272 | 252.4 |
| B | 4 | 81 | 68365 | 265.82 | 1307 | 1272 | 252.4 |
| B | 12 | 111 | 27883 | 105.43 | 1307 | 1272 | 252.4 |
| C | 1 | 16 | 101899 | 341.4 | 1270 | 1272 | 294.7 |
| C | 14 | 67 | 14496 | 44.87 | 1270 | 1272 | 294.7 |
| C | 13 | 61 | 9661 | 28.46 | 1270 | 1272 | 294.7 |
| D | 1 | 52 | 1191722 | 3732.15 | 1241 | 1209 | 319.0 |
| D | 4 | 95 | 305537 | 954.04 | 1241 | 1209 | 319.0 |
| D | 2 | 136 | 182645 | 568.78 | 1241 | 1209 | 319.0 |
Histogram calculated using DETX and DETY for each event in the final _common_clean file
| Quadrant A | 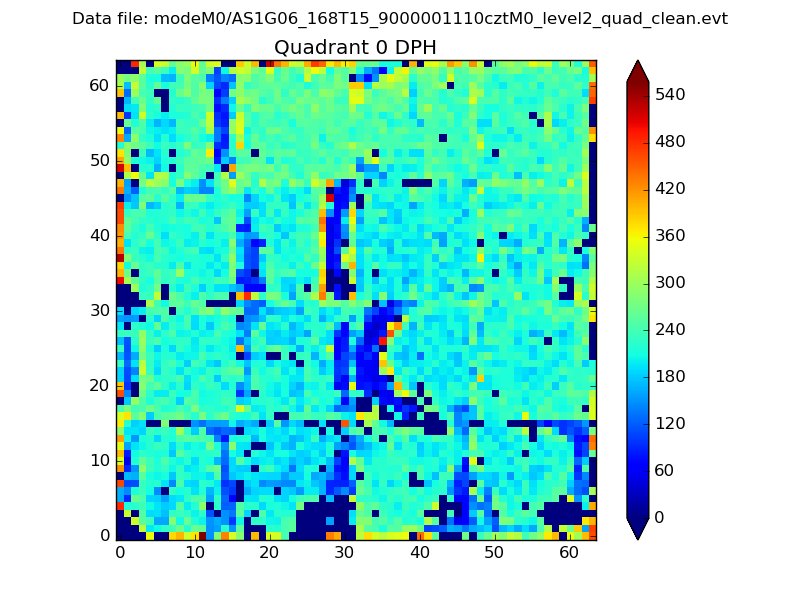 |
 |
Quadrant B |
|---|---|---|---|
| Quadrant D |  |
 |
Quadrant C |
| Plot type | Count rate plots | Images |
|---|---|---|
| Comparison with Poisson distribution Blue bars denote a histogram of data divided into 1 sec bins. Red curve is a Poisson curve with rate = median count rate of data. |
 |
 |
| Quadrant-wise count rates Data is divided into 100 sec bins |
 |
|
| Module-wise count rates for Quadrant A Data is divided into 100 sec bins |
 |
 |
| Module-wise count rates for Quadrant B Data is divided into 100 sec bins |
 |
 |
| Module-wise count rates for Quadrant C Data is divided into 100 sec bins |
 |
 |
| Module-wise count rates for Quadrant D Data is divided into 100 sec bins |
 |
 |
| Parameter | Plot |
|---|---|
| CZT HV Monitor | 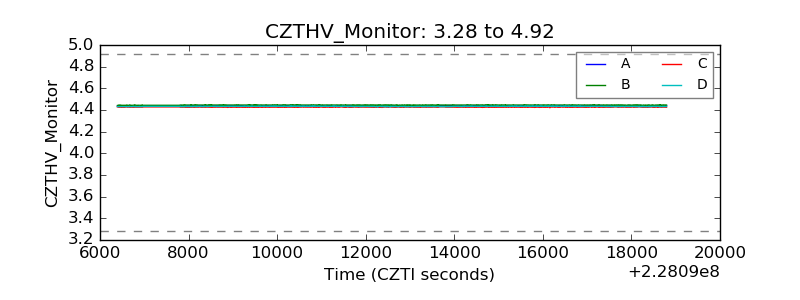 |
| D_VDD |  |
| Temperature 1 |  |
| Veto HV Monitor |  |
| Veto LLD | 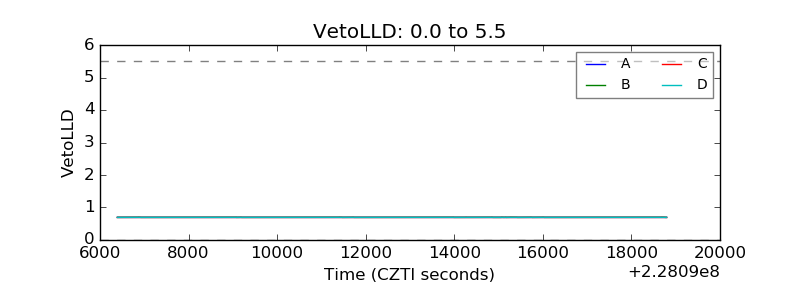 |
| Alpha Counter |  |
| _CPM_Rate | 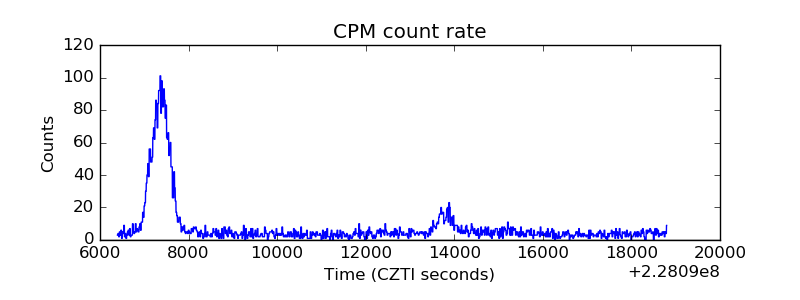 |
| CZT Counter | 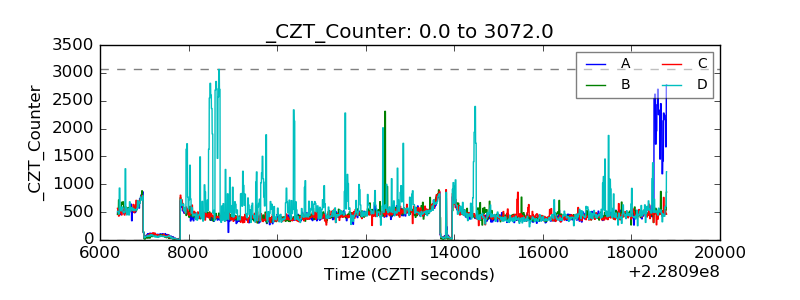 |
| +2.5 Volts monitor |  |
| +5 Volts monitor |  |
| _ROLL_ROT | 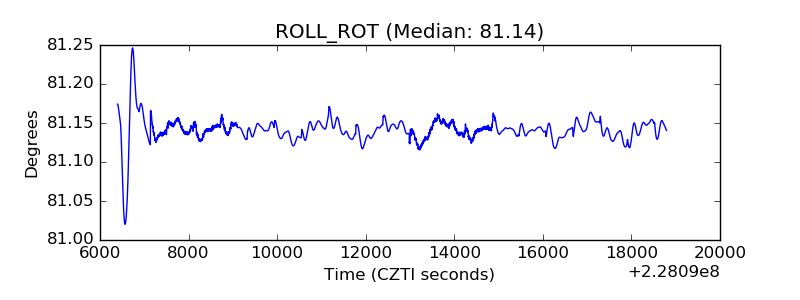 |
| _Roll_DEC |  |
| _Roll_RA |  |
| Veto Counter |  |