| Param | Original file | Final file |
|---|---|---|
| Filename | modeM0/AS1G05_246T02_9000001106cztM0_level2.evt | modeM0/AS1G05_246T02_9000001106cztM0_level2_quad_clean.evt |
| Size (bytes) | 4,341,934,080 | 803,128,320 |
| Size | 4.0 GB | 765.9 MB |
| Events in quadrant A | 31,338,460 | 5,062,801 |
| Events in quadrant B | 31,750,171 | 5,182,184 |
| Events in quadrant C | 29,015,562 | 5,054,100 |
| Events in quadrant D | 35,218,376 | 4,785,149 |
| Mode M9 | |||
|---|---|---|---|
| Quadrant | BADHDUFLAG | Total packets | Discarded packets |
| A | 0 | 68 | 0 |
| B | 0 | 68 | 0 |
| C | 0 | 68 | 0 |
| D | 0 | 68 | 0 |
| Mode SS | |||
|---|---|---|---|
| Quadrant | BADHDUFLAG | Total packets | Discarded packets |
| A | 0 | 1252 | 0 |
| B | 0 | 1252 | 0 |
| C | 0 | 1252 | 0 |
| D | 0 | 1252 | 0 |
| Mode M0 | |||
|---|---|---|---|
| Quadrant | BADHDUFLAG | Total packets | Discarded packets |
| A | 0 | 135718 | 0 |
| B | 0 | 135391 | 0 |
| C | 0 | 129743 | 0 |
| D | 0 | 149274 | 0 |
| Quadrant | Total seconds | Saturated seconds | Saturation percentage |
|---|---|---|---|
| A | 61835 | 1332 | 2.154120% |
| B | 61835 | 1523 | 2.463006% |
| C | 61835 | 1032 | 1.668958% |
| D | 61835 | 2784 | 4.502305% |
Noise dominated data is calculated using 1-second bins in cleaned event files. If a bin has >2000 counts, and if more than 50% of those come from <1% of pixels, then it is considered to be noise-dominated and hence unusable.
| Quadrant | # 1 sec bins | Bins with >0 counts | Bins with >2000 counts | High rate bins dominated by noise | Noise dominated (total time) | Noise dominated (detector-on time) | Marked lightcurve |
|---|---|---|---|---|---|---|---|
| A | 82254 | 61846 | 282 | 282 | 0.34% | 0.46% |  |
| B | 82254 | 61846 | 304 | 304 | 0.37% | 0.49% | 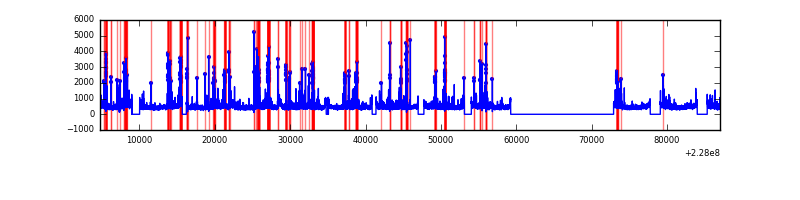 |
| C | 82254 | 61846 | 189 | 189 | 0.23% | 0.31% |  |
| D | 82254 | 61846 | 1771 | 1771 | 2.15% | 2.86% | 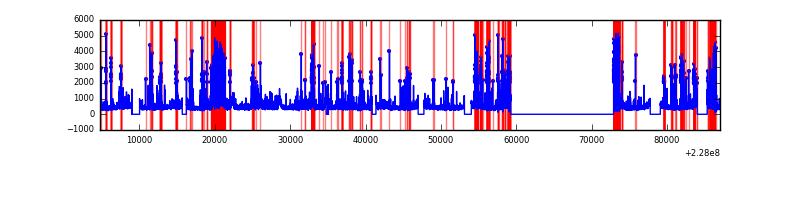 |
Top three noisy pixels from each quadrant. If the there are fewer than three noisy pixels in the level2.evt file, extra rows are filled as -1
| Pixel properties | Quadrant properties | ||||||
|---|---|---|---|---|---|---|---|
| Quadrant | DetID | PixID | Counts | Sigma | Mean | Median | Sigma |
| A | 4 | 2 | 2970434 | 2027.64 | 7240 | 7087 | 1461.5 |
| A | 15 | 79 | 234611 | 155.68 | 7240 | 7087 | 1461.5 |
| A | 0 | 128 | 226602 | 150.2 | 7240 | 7087 | 1461.5 |
| B | 4 | 239 | 1405943 | 1016.47 | 7306 | 7131 | 1376.1 |
| B | 10 | 16 | 524613 | 376.04 | 7306 | 7131 | 1376.1 |
| B | 11 | 51 | 355168 | 252.91 | 7306 | 7131 | 1376.1 |
| C | 4 | 254 | 994974 | 603.17 | 7104 | 7126 | 1637.8 |
| C | 1 | 16 | 278542 | 165.72 | 7104 | 7126 | 1637.8 |
| C | 13 | 61 | 54012 | 28.63 | 7104 | 7126 | 1637.8 |
| D | 13 | 169 | 4673993 | 2604.66 | 6909 | 6751 | 1791.9 |
| D | 1 | 52 | 2718841 | 1513.54 | 6909 | 6751 | 1791.9 |
| D | 2 | 136 | 522012 | 287.55 | 6909 | 6751 | 1791.9 |
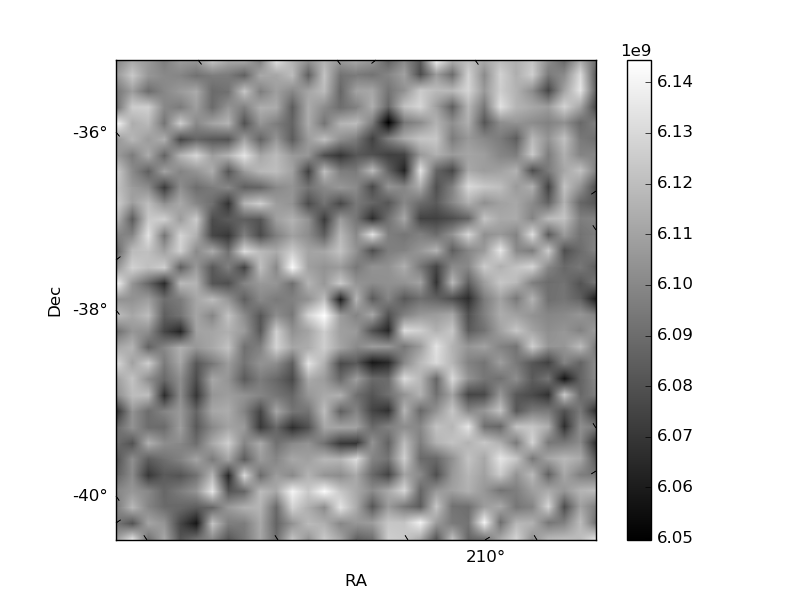
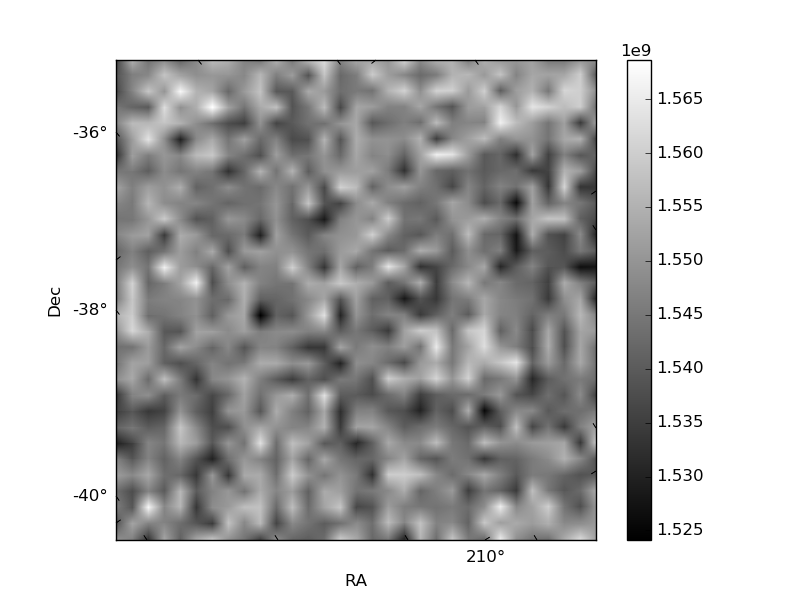
Histogram calculated using DETX and DETY for each event in the final _common_clean file
| Quadrant A |  |
 |
Quadrant B |
|---|---|---|---|
| Quadrant D |  |
 |
Quadrant C |
| Plot type | Count rate plots | Images |
|---|---|---|
| Comparison with Poisson distribution Blue bars denote a histogram of data divided into 1 sec bins. Red curve is a Poisson curve with rate = median count rate of data. |
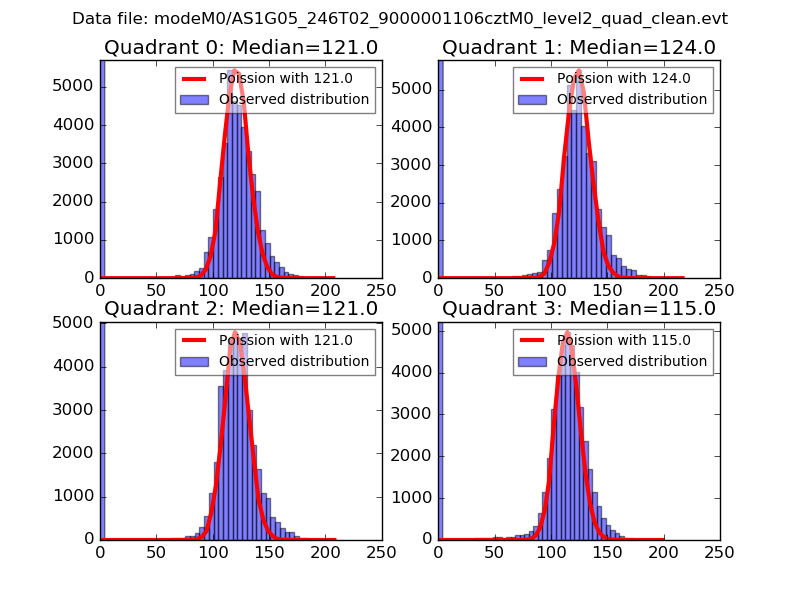 |
 |
| Quadrant-wise count rates Data is divided into 100 sec bins |
 |
|
| Module-wise count rates for Quadrant A Data is divided into 100 sec bins |
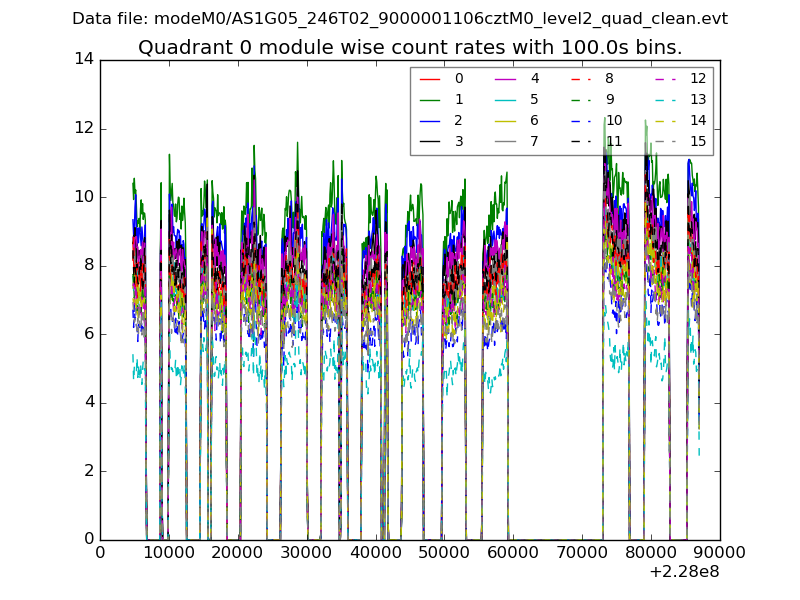 |
 |
| Module-wise count rates for Quadrant B Data is divided into 100 sec bins |
 |
 |
| Module-wise count rates for Quadrant C Data is divided into 100 sec bins |
 |
 |
| Module-wise count rates for Quadrant D Data is divided into 100 sec bins |
 |
 |
| Parameter | Plot |
|---|---|
| CZT HV Monitor |  |
| D_VDD | 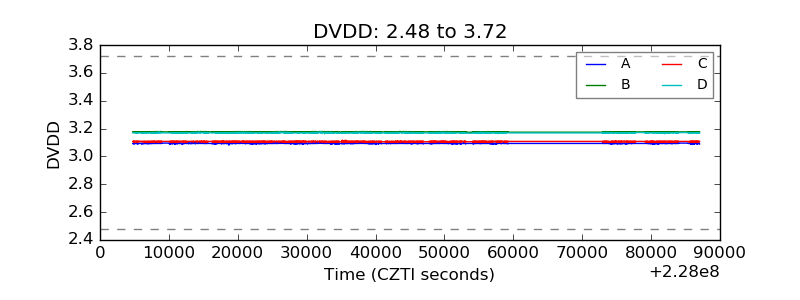 |
| Temperature 1 |  |
| Veto HV Monitor |  |
| Veto LLD |  |
| Alpha Counter | 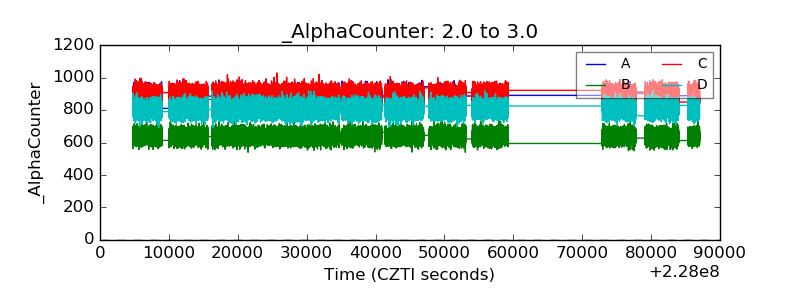 |
| _CPM_Rate |  |
| CZT Counter |  |
| +2.5 Volts monitor | 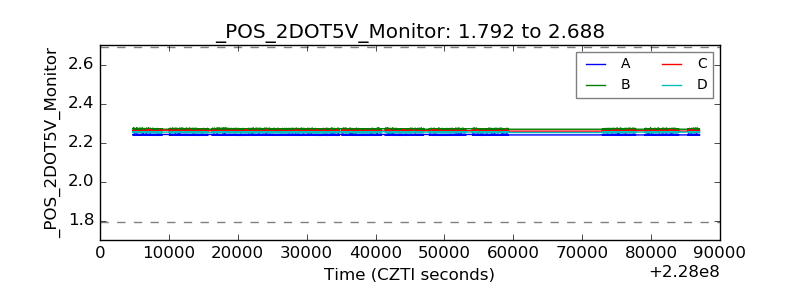 |
| +5 Volts monitor | 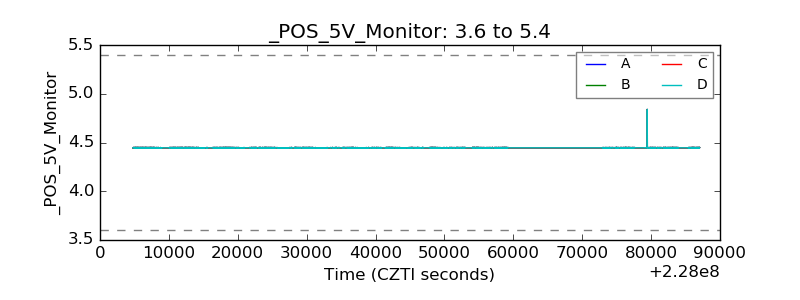 |
| _ROLL_ROT | 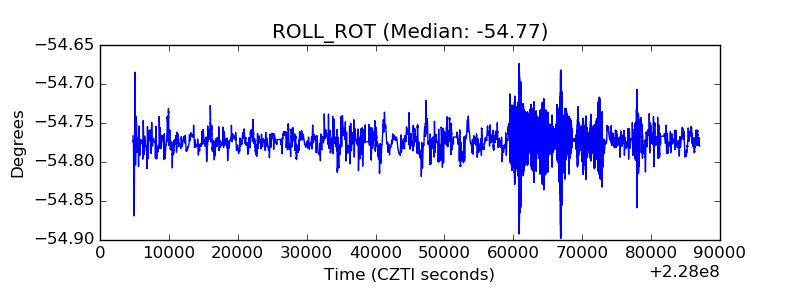 |
| _Roll_DEC |  |
| _Roll_RA |  |
| Veto Counter |  |