| Param | Original file | Final file |
|---|---|---|
| Filename | modeM0/AS1A02_080T01_9000001104cztM0_level2.evt | modeM0/AS1A02_080T01_9000001104cztM0_level2_quad_clean.evt |
| Size (bytes) | 3,256,646,400 | 602,176,320 |
| Size | 3.0 GB | 574.3 MB |
| Events in quadrant A | 20,082,360 | 3,972,310 |
| Events in quadrant B | 22,515,861 | 4,029,566 |
| Events in quadrant C | 19,128,895 | 3,891,742 |
| Events in quadrant D | 34,076,716 | 3,470,215 |
| Mode SS | |||
|---|---|---|---|
| Quadrant | BADHDUFLAG | Total packets | Discarded packets |
| A | 0 | 852 | 0 |
| B | 0 | 852 | 0 |
| C | 0 | 852 | 0 |
| D | 0 | 852 | 0 |
| Mode M9 | |||
|---|---|---|---|
| Quadrant | BADHDUFLAG | Total packets | Discarded packets |
| A | 0 | 87 | 0 |
| B | 0 | 87 | 0 |
| C | 0 | 87 | 0 |
| D | 0 | 87 | 0 |
| Mode M0 | |||
|---|---|---|---|
| Quadrant | BADHDUFLAG | Total packets | Discarded packets |
| A | 0 | 88267 | 0 |
| B | 0 | 94459 | 0 |
| C | 0 | 86034 | 0 |
| D | 0 | 130440 | 0 |
| Quadrant | Total seconds | Saturated seconds | Saturation percentage |
|---|---|---|---|
| A | 41865 | 561 | 1.340021% |
| B | 41862 | 1084 | 2.589461% |
| C | 41864 | 314 | 0.750048% |
| D | 41864 | 4636 | 11.073954% |
Noise dominated data is calculated using 1-second bins in cleaned event files. If a bin has >2000 counts, and if more than 50% of those come from <1% of pixels, then it is considered to be noise-dominated and hence unusable.
| Quadrant | # 1 sec bins | Bins with >0 counts | Bins with >2000 counts | High rate bins dominated by noise | Noise dominated (total time) | Noise dominated (detector-on time) | Marked lightcurve |
|---|---|---|---|---|---|---|---|
| A | 50668 | 41877 | 49 | 49 | 0.10% | 0.12% |  |
| B | 50668 | 41877 | 361 | 361 | 0.71% | 0.86% |  |
| C | 50668 | 41877 | 0 | 0 | 0.00% | 0.00% |  |
| D | 50668 | 41876 | 3652 | 3652 | 7.21% | 8.72% |  |
Top three noisy pixels from each quadrant. If the there are fewer than three noisy pixels in the level2.evt file, extra rows are filled as -1
| Pixel properties | Quadrant properties | ||||||
|---|---|---|---|---|---|---|---|
| Quadrant | DetID | PixID | Counts | Sigma | Mean | Median | Sigma |
| A | 4 | 2 | 640270 | 639.05 | 4994 | 4889 | 994.3 |
| A | 15 | 234 | 109558 | 105.27 | 4994 | 4889 | 994.3 |
| A | 0 | 226 | 46976 | 42.33 | 4994 | 4889 | 994.3 |
| B | 4 | 239 | 1471849 | 1570.35 | 5027 | 4905 | 934.2 |
| B | 11 | 51 | 456380 | 483.3 | 5027 | 4905 | 934.2 |
| B | 10 | 16 | 359752 | 379.86 | 5027 | 4905 | 934.2 |
| C | 1 | 16 | 115557 | 99.24 | 4867 | 4895 | 1115.1 |
| C | 13 | 61 | 37392 | 29.14 | 4867 | 4895 | 1115.1 |
| C | 8 | 222 | 25100 | 18.12 | 4867 | 4895 | 1115.1 |
| D | 2 | 250 | 11409123 | 9381.35 | 4561 | 4456 | 1215.7 |
| D | 13 | 169 | 2392516 | 1964.39 | 4561 | 4456 | 1215.7 |
| D | 1 | 52 | 1422801 | 1166.72 | 4561 | 4456 | 1215.7 |
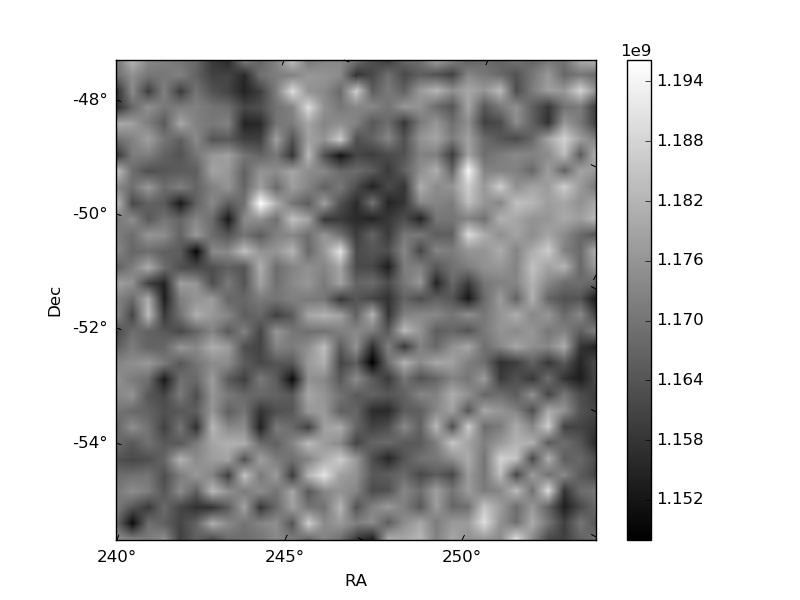
Histogram calculated using DETX and DETY for each event in the final _common_clean file
| Quadrant A | 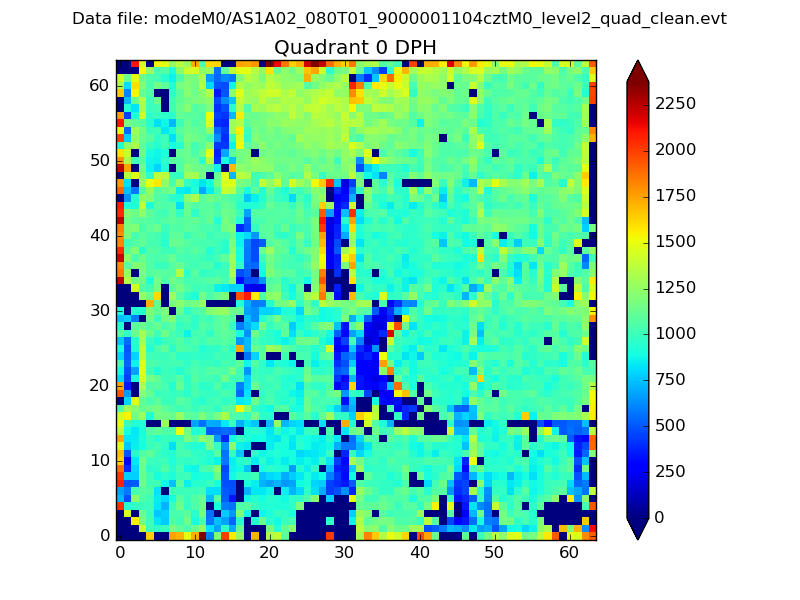 |
 |
Quadrant B |
|---|---|---|---|
| Quadrant D |  |
 |
Quadrant C |
| Plot type | Count rate plots | Images |
|---|---|---|
| Comparison with Poisson distribution Blue bars denote a histogram of data divided into 1 sec bins. Red curve is a Poisson curve with rate = median count rate of data. |
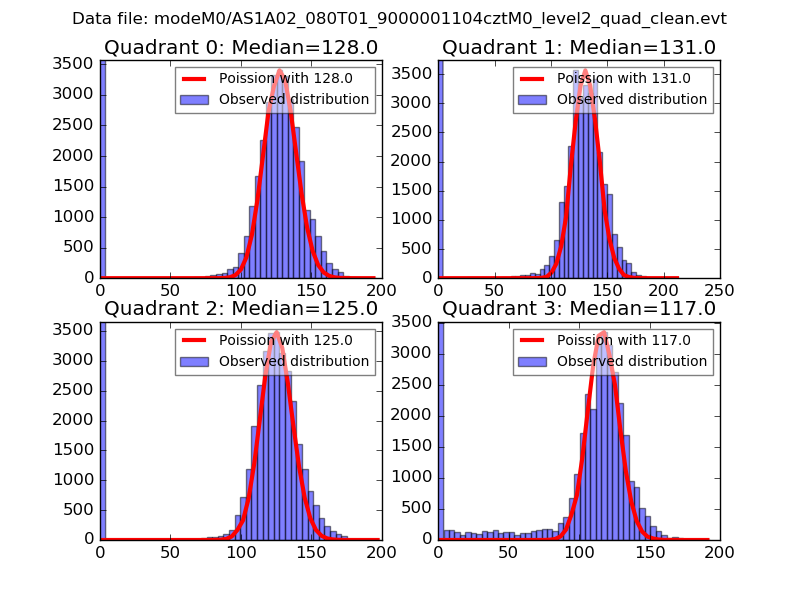 |
 |
| Quadrant-wise count rates Data is divided into 100 sec bins |
 |
|
| Module-wise count rates for Quadrant A Data is divided into 100 sec bins |
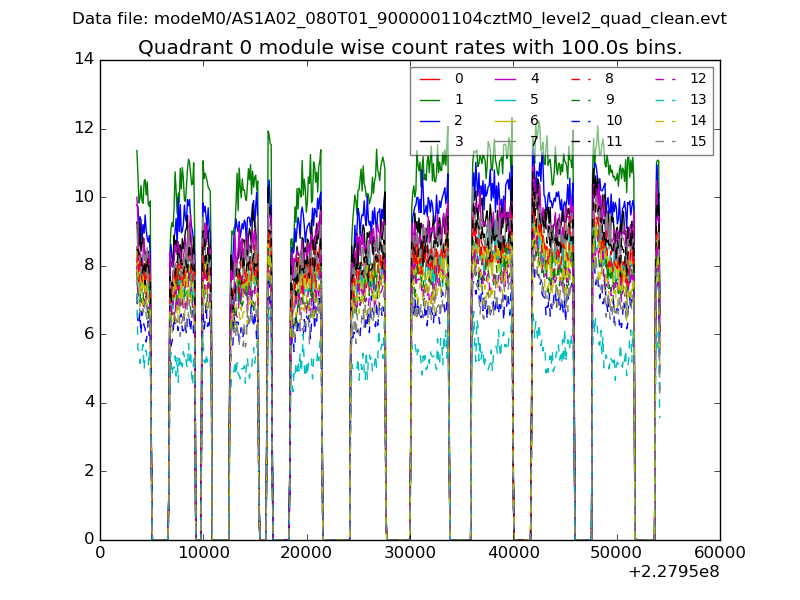 |
 |
| Module-wise count rates for Quadrant B Data is divided into 100 sec bins |
 |
 |
| Module-wise count rates for Quadrant C Data is divided into 100 sec bins |
 |
 |
| Module-wise count rates for Quadrant D Data is divided into 100 sec bins |
 |
 |
| Parameter | Plot |
|---|---|
| CZT HV Monitor | 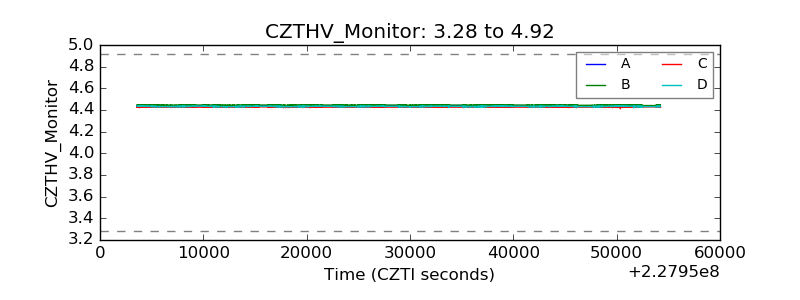 |
| D_VDD | 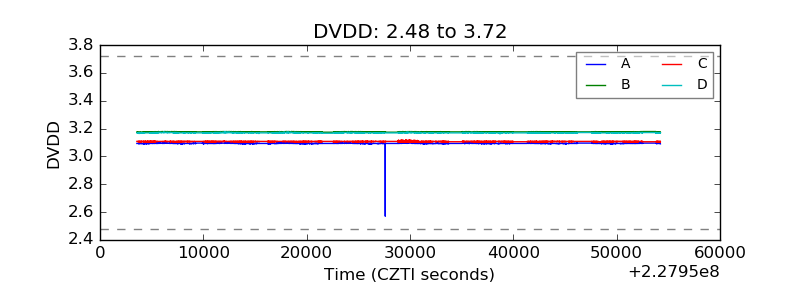 |
| Temperature 1 |  |
| Veto HV Monitor |  |
| Veto LLD |  |
| Alpha Counter | 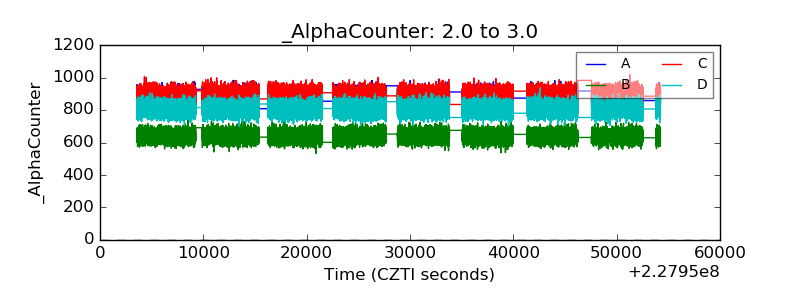 |
| _CPM_Rate |  |
| CZT Counter | 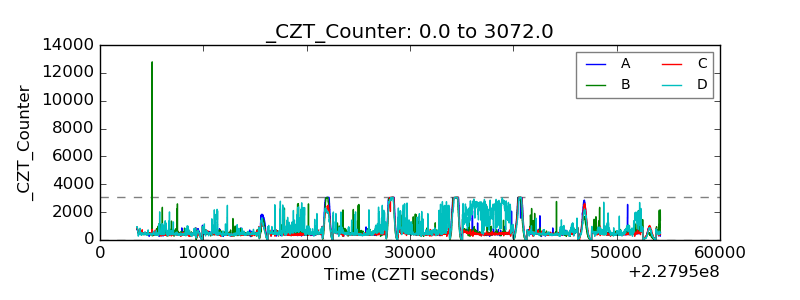 |
| +2.5 Volts monitor | 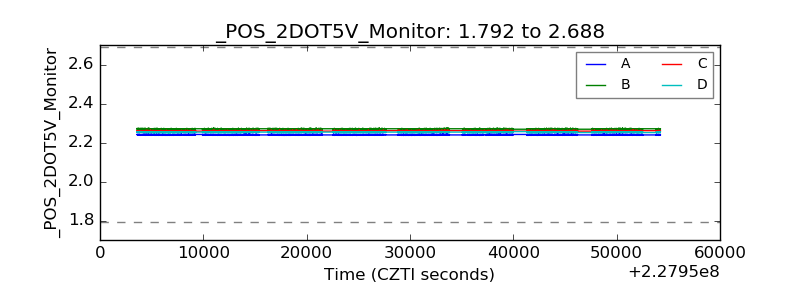 |
| +5 Volts monitor |  |
| _ROLL_ROT |  |
| _Roll_DEC |  |
| _Roll_RA |  |
| Veto Counter |  |