| Param | Original file | Final file |
|---|---|---|
| Filename | modeM0/AS1G06_154T02_9000001102cztM0_level2.evt | modeM0/AS1G06_154T02_9000001102cztM0_level2_quad_clean.evt |
| Size (bytes) | 3,579,531,840 | 716,483,520 |
| Size | 3.3 GB | 683.3 MB |
| Events in quadrant A | 25,331,566 | 4,429,899 |
| Events in quadrant B | 26,335,798 | 4,576,607 |
| Events in quadrant C | 25,395,224 | 4,573,510 |
| Events in quadrant D | 27,653,036 | 4,372,903 |
| Mode M0 | |||
|---|---|---|---|
| Quadrant | BADHDUFLAG | Total packets | Discarded packets |
| A | 0 | 112981 | 0 |
| B | 0 | 114709 | 0 |
| C | 0 | 113183 | 0 |
| D | 0 | 121432 | 0 |
| Mode SS | |||
|---|---|---|---|
| Quadrant | BADHDUFLAG | Total packets | Discarded packets |
| A | 0 | 1112 | 0 |
| B | 0 | 1112 | 0 |
| C | 0 | 1112 | 0 |
| D | 0 | 1112 | 0 |
| Quadrant | Total seconds | Saturated seconds | Saturation percentage |
|---|---|---|---|
| A | 54642 | 575 | 1.052304% |
| B | 54645 | 768 | 1.405435% |
| C | 54644 | 394 | 0.721031% |
| D | 54644 | 927 | 1.696435% |
Noise dominated data is calculated using 1-second bins in cleaned event files. If a bin has >2000 counts, and if more than 50% of those come from <1% of pixels, then it is considered to be noise-dominated and hence unusable.
| Quadrant | # 1 sec bins | Bins with >0 counts | Bins with >2000 counts | High rate bins dominated by noise | Noise dominated (total time) | Noise dominated (detector-on time) | Marked lightcurve |
|---|---|---|---|---|---|---|---|
| A | 63206 | 54656 | 2 | 2 | 0.00% | 0.00% | 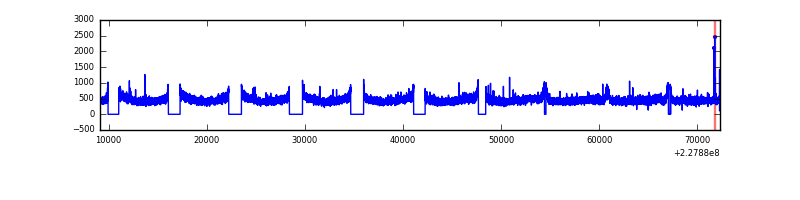 |
| B | 63206 | 54656 | 15 | 15 | 0.02% | 0.03% | 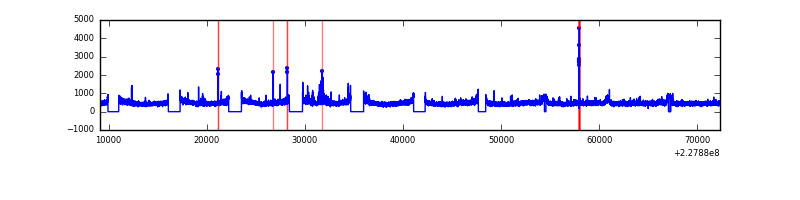 |
| C | 63206 | 54656 | 0 | 0 | 0.00% | 0.00% |  |
| D | 63206 | 54656 | 505 | 505 | 0.80% | 0.92% | 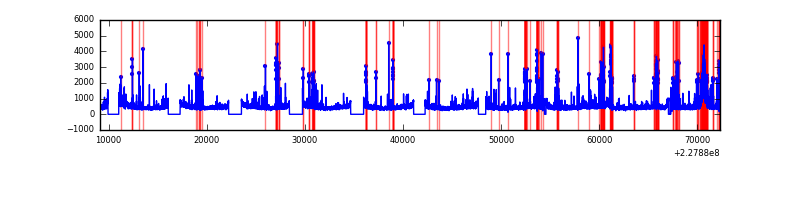 |
Top three noisy pixels from each quadrant. If the there are fewer than three noisy pixels in the level2.evt file, extra rows are filled as -1
| Pixel properties | Quadrant properties | ||||||
|---|---|---|---|---|---|---|---|
| Quadrant | DetID | PixID | Counts | Sigma | Mean | Median | Sigma |
| A | 0 | 226 | 61221 | 41.54 | 6561 | 6419 | 1319.2 |
| A | 12 | 194 | 57180 | 38.48 | 6561 | 6419 | 1319.2 |
| A | 0 | 128 | 39154 | 24.81 | 6561 | 6419 | 1319.2 |
| B | 5 | 250 | 493325 | 388.96 | 6622 | 6463 | 1251.7 |
| B | 12 | 111 | 143614 | 109.57 | 6622 | 6463 | 1251.7 |
| B | 11 | 111 | 116357 | 87.8 | 6622 | 6463 | 1251.7 |
| C | 1 | 16 | 64131 | 38.42 | 6484 | 6518 | 1499.6 |
| C | 13 | 61 | 49262 | 28.5 | 6484 | 6518 | 1499.6 |
| C | 8 | 222 | 31269 | 16.5 | 6484 | 6518 | 1499.6 |
| D | 13 | 169 | 1240304 | 815.27 | 6393 | 6240 | 1513.7 |
| D | 1 | 52 | 965794 | 633.92 | 6393 | 6240 | 1513.7 |
| D | 2 | 14 | 812724 | 532.79 | 6393 | 6240 | 1513.7 |
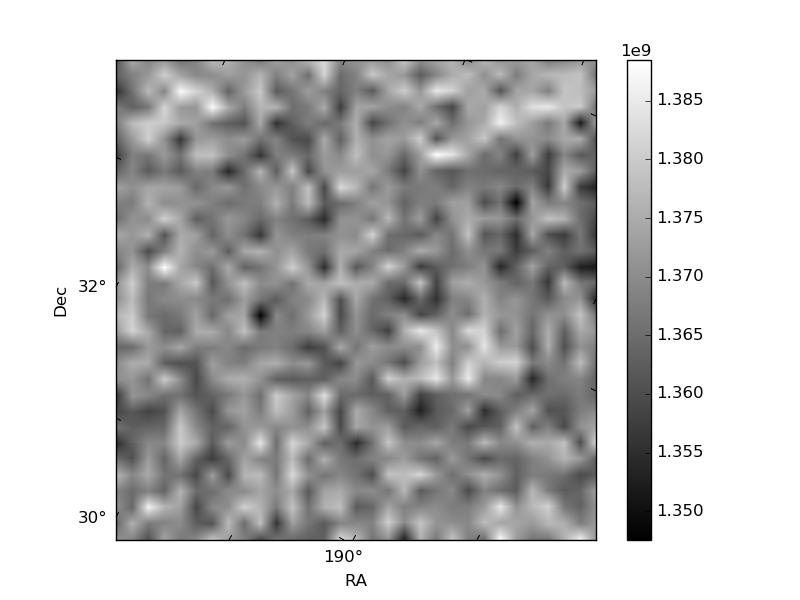
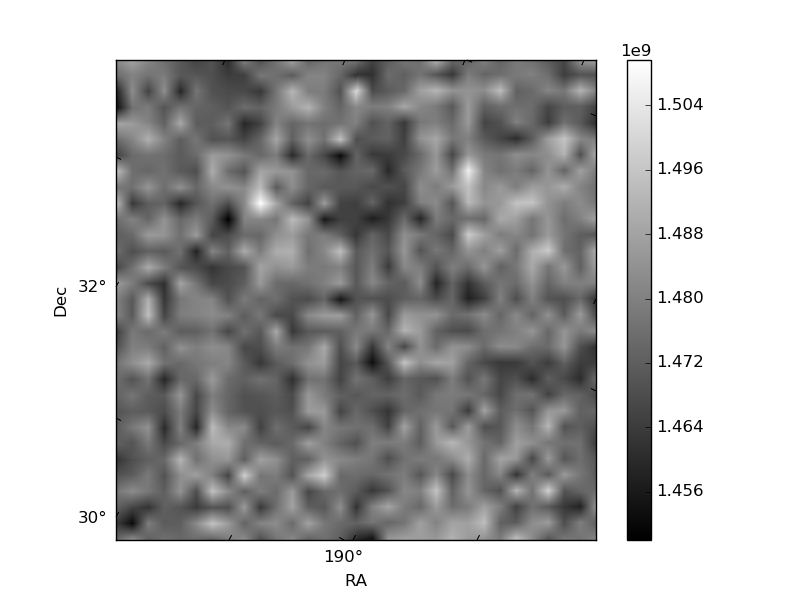
Histogram calculated using DETX and DETY for each event in the final _common_clean file
| Quadrant A |  |
 |
Quadrant B |
|---|---|---|---|
| Quadrant D |  |
 |
Quadrant C |
| Plot type | Count rate plots | Images |
|---|---|---|
| Comparison with Poisson distribution Blue bars denote a histogram of data divided into 1 sec bins. Red curve is a Poisson curve with rate = median count rate of data. |
 |
 |
| Quadrant-wise count rates Data is divided into 100 sec bins |
 |
|
| Module-wise count rates for Quadrant A Data is divided into 100 sec bins |
 |
 |
| Module-wise count rates for Quadrant B Data is divided into 100 sec bins |
 |
 |
| Module-wise count rates for Quadrant C Data is divided into 100 sec bins |
 |
 |
| Module-wise count rates for Quadrant D Data is divided into 100 sec bins |
 |
 |
| Parameter | Plot |
|---|---|
| CZT HV Monitor |  |
| D_VDD |  |
| Temperature 1 | 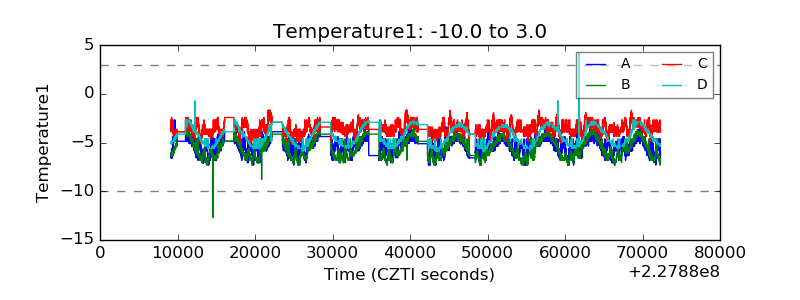 |
| Veto HV Monitor |  |
| Veto LLD | 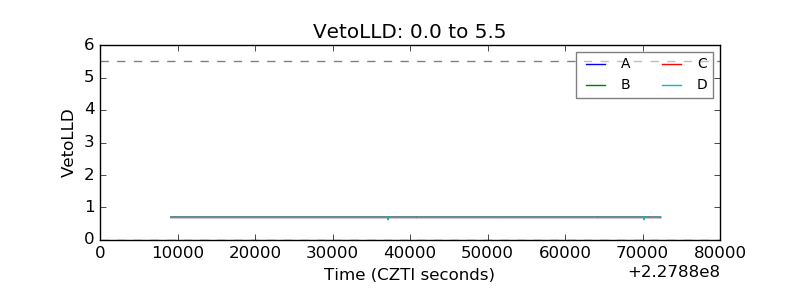 |
| Alpha Counter |  |
| _CPM_Rate |  |
| CZT Counter | 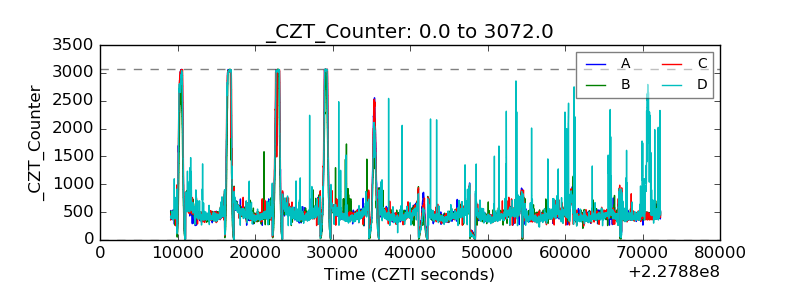 |
| +2.5 Volts monitor |  |
| +5 Volts monitor |  |
| _ROLL_ROT |  |
| _Roll_DEC |  |
| _Roll_RA | 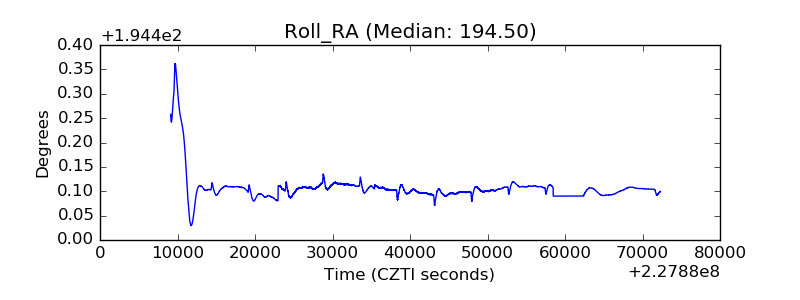 |
| Veto Counter |  |