| Param | Original file | Final file |
|---|---|---|
| Filename | modeM0/AS1G06_138T03_9000001096cztM0_level2.evt | modeM0/AS1G06_138T03_9000001096cztM0_level2_quad_clean.evt |
| Size (bytes) | 3,667,006,080 | 675,135,360 |
| Size | 3.4 GB | 643.9 MB |
| Events in quadrant A | 24,230,237 | 4,203,301 |
| Events in quadrant B | 25,177,277 | 4,304,306 |
| Events in quadrant C | 25,646,755 | 4,284,746 |
| Events in quadrant D | 32,470,078 | 4,066,778 |
| Mode SS | |||
|---|---|---|---|
| Quadrant | BADHDUFLAG | Total packets | Discarded packets |
| A | 0 | 1064 | 0 |
| B | 0 | 1064 | 0 |
| C | 0 | 1064 | 0 |
| D | 0 | 1064 | 0 |
| Mode M9 | |||
|---|---|---|---|
| Quadrant | BADHDUFLAG | Total packets | Discarded packets |
| A | 0 | 68 | 0 |
| B | 0 | 68 | 0 |
| C | 0 | 68 | 0 |
| D | 0 | 68 | 0 |
| Mode M0 | |||
|---|---|---|---|
| Quadrant | BADHDUFLAG | Total packets | Discarded packets |
| A | 0 | 107989 | 0 |
| B | 0 | 109615 | 0 |
| C | 0 | 110735 | 0 |
| D | 0 | 132714 | 0 |
| Quadrant | Total seconds | Saturated seconds | Saturation percentage |
|---|---|---|---|
| A | 52329 | 818 | 1.563187% |
| B | 52325 | 943 | 1.802198% |
| C | 52321 | 601 | 1.148678% |
| D | 52327 | 2649 | 5.062396% |
Noise dominated data is calculated using 1-second bins in cleaned event files. If a bin has >2000 counts, and if more than 50% of those come from <1% of pixels, then it is considered to be noise-dominated and hence unusable.
| Quadrant | # 1 sec bins | Bins with >0 counts | Bins with >2000 counts | High rate bins dominated by noise | Noise dominated (total time) | Noise dominated (detector-on time) | Marked lightcurve |
|---|---|---|---|---|---|---|---|
| A | 59012 | 52343 | 3 | 3 | 0.01% | 0.01% |  |
| B | 59012 | 52343 | 15 | 15 | 0.03% | 0.03% |  |
| C | 59012 | 52342 | 1 | 1 | 0.00% | 0.00% |  |
| D | 59012 | 52343 | 1838 | 1838 | 3.11% | 3.51% |  |
Top three noisy pixels from each quadrant. If the there are fewer than three noisy pixels in the level2.evt file, extra rows are filled as -1
| Pixel properties | Quadrant properties | ||||||
|---|---|---|---|---|---|---|---|
| Quadrant | DetID | PixID | Counts | Sigma | Mean | Median | Sigma |
| A | 15 | 239 | 143490 | 109.59 | 6213 | 6081 | 1253.8 |
| A | 0 | 128 | 70074 | 51.04 | 6213 | 6081 | 1253.8 |
| A | 0 | 226 | 57618 | 41.1 | 6213 | 6081 | 1253.8 |
| B | 5 | 255 | 523767 | 434.11 | 6257 | 6093 | 1192.5 |
| B | 11 | 51 | 174554 | 141.27 | 6257 | 6093 | 1192.5 |
| B | 12 | 111 | 135919 | 108.87 | 6257 | 6093 | 1192.5 |
| C | 8 | 208 | 1597283 | 1124.65 | 6115 | 6136 | 1414.8 |
| C | 1 | 16 | 116201 | 77.8 | 6115 | 6136 | 1414.8 |
| C | 13 | 61 | 46430 | 28.48 | 6115 | 6136 | 1414.8 |
| D | 1 | 52 | 5580821 | 3769.6 | 5987 | 5824 | 1478.9 |
| D | 1 | 83 | 2166619 | 1461.05 | 5987 | 5824 | 1478.9 |
| D | 2 | 14 | 619827 | 415.17 | 5987 | 5824 | 1478.9 |
Histogram calculated using DETX and DETY for each event in the final _common_clean file
| Quadrant A |  |
 |
Quadrant B |
|---|---|---|---|
| Quadrant D |  |
 |
Quadrant C |
| Plot type | Count rate plots | Images |
|---|---|---|
| Comparison with Poisson distribution Blue bars denote a histogram of data divided into 1 sec bins. Red curve is a Poisson curve with rate = median count rate of data. |
 |
 |
| Quadrant-wise count rates Data is divided into 100 sec bins |
 |
|
| Module-wise count rates for Quadrant A Data is divided into 100 sec bins |
 |
 |
| Module-wise count rates for Quadrant B Data is divided into 100 sec bins |
 |
 |
| Module-wise count rates for Quadrant C Data is divided into 100 sec bins |
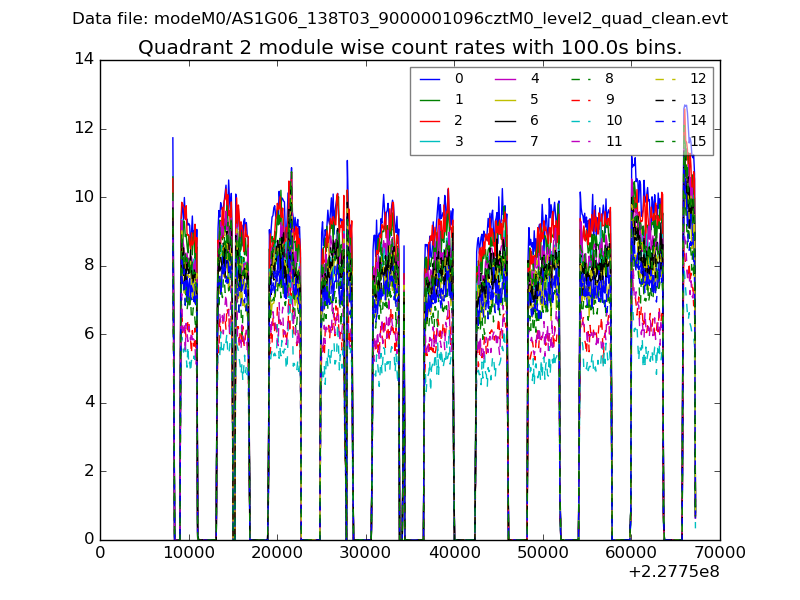 |
 |
| Module-wise count rates for Quadrant D Data is divided into 100 sec bins |
 |
 |
| Parameter | Plot |
|---|---|
| CZT HV Monitor |  |
| D_VDD |  |
| Temperature 1 |  |
| Veto HV Monitor |  |
| Veto LLD |  |
| Alpha Counter |  |
| _CPM_Rate |  |
| CZT Counter |  |
| +2.5 Volts monitor | 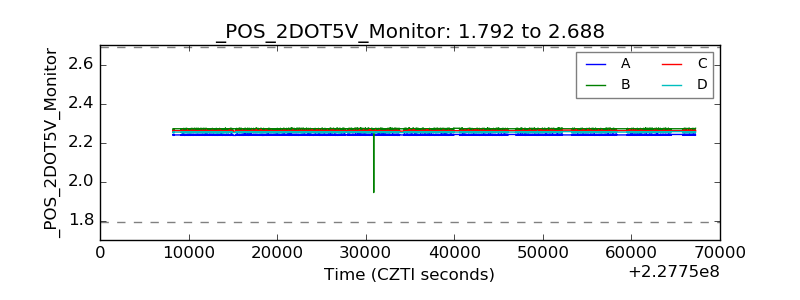 |
| +5 Volts monitor |  |
| _ROLL_ROT |  |
| _Roll_DEC |  |
| _Roll_RA |  |
| Veto Counter |  |