| Param | Original file | Final file |
|---|---|---|
| Filename | modeM0/AS1A02_165T03_9000001098cztM0_level2.evt | modeM0/AS1A02_165T03_9000001098cztM0_level2_quad_clean.evt |
| Size (bytes) | 581,221,440 | 118,632,960 |
| Size | 554.3 MB | 113.1 MB |
| Events in quadrant A | 3,922,398 | 740,687 |
| Events in quadrant B | 4,130,026 | 765,306 |
| Events in quadrant C | 3,959,622 | 775,368 |
| Events in quadrant D | 5,019,798 | 727,546 |
| Mode M9 | |||
|---|---|---|---|
| Quadrant | BADHDUFLAG | Total packets | Discarded packets |
| A | 0 | 27 | 0 |
| B | 0 | 27 | 0 |
| C | 0 | 27 | 0 |
| D | 0 | 27 | 0 |
| Mode M0 | |||
|---|---|---|---|
| Quadrant | BADHDUFLAG | Total packets | Discarded packets |
| A | 0 | 17458 | 0 |
| B | 0 | 17927 | 0 |
| C | 0 | 17529 | 0 |
| D | 0 | 20785 | 0 |
| Mode SS | |||
|---|---|---|---|
| Quadrant | BADHDUFLAG | Total packets | Discarded packets |
| A | 0 | 172 | 0 |
| B | 0 | 172 | 0 |
| C | 0 | 172 | 0 |
| D | 0 | 172 | 0 |
| Quadrant | Total seconds | Saturated seconds | Saturation percentage |
|---|---|---|---|
| A | 8409 | 59 | 0.701629% |
| B | 8409 | 101 | 1.201094% |
| C | 8409 | 64 | 0.761089% |
| D | 8409 | 162 | 1.926507% |
Noise dominated data is calculated using 1-second bins in cleaned event files. If a bin has >2000 counts, and if more than 50% of those come from <1% of pixels, then it is considered to be noise-dominated and hence unusable.
| Quadrant | # 1 sec bins | Bins with >0 counts | Bins with >2000 counts | High rate bins dominated by noise | Noise dominated (total time) | Noise dominated (detector-on time) | Marked lightcurve |
|---|---|---|---|---|---|---|---|
| A | 11105 | 8411 | 0 | 0 | 0.00% | 0.00% |  |
| B | 11105 | 8411 | 4 | 4 | 0.04% | 0.05% |  |
| C | 11105 | 8411 | 0 | 0 | 0.00% | 0.00% |  |
| D | 11105 | 8411 | 81 | 81 | 0.73% | 0.96% |  |
Top three noisy pixels from each quadrant. If the there are fewer than three noisy pixels in the level2.evt file, extra rows are filled as -1
| Pixel properties | Quadrant properties | ||||||
|---|---|---|---|---|---|---|---|
| Quadrant | DetID | PixID | Counts | Sigma | Mean | Median | Sigma |
| A | 0 | 226 | 9471 | 41.77 | 1012 | 991 | 203.0 |
| A | 13 | 14 | 8968 | 39.29 | 1012 | 991 | 203.0 |
| A | 12 | 194 | 8784 | 38.39 | 1012 | 991 | 203.0 |
| B | 4 | 239 | 45243 | 231.48 | 1027 | 1003 | 191.1 |
| B | 5 | 255 | 44509 | 227.63 | 1027 | 1003 | 191.1 |
| B | 12 | 111 | 21084 | 105.07 | 1027 | 1003 | 191.1 |
| C | 1 | 16 | 19481 | 80.05 | 1007 | 1014 | 230.7 |
| C | 13 | 61 | 7641 | 28.73 | 1007 | 1014 | 230.7 |
| C | 9 | 236 | 3546 | 10.98 | 1007 | 1014 | 230.7 |
| D | 1 | 52 | 476332 | 1993.77 | 987 | 963 | 238.4 |
| D | 11 | 144 | 410668 | 1718.37 | 987 | 963 | 238.4 |
| D | 2 | 14 | 271410 | 1134.3 | 987 | 963 | 238.4 |
Histogram calculated using DETX and DETY for each event in the final _common_clean file
| Quadrant A |  |
 |
Quadrant B |
|---|---|---|---|
| Quadrant D |  |
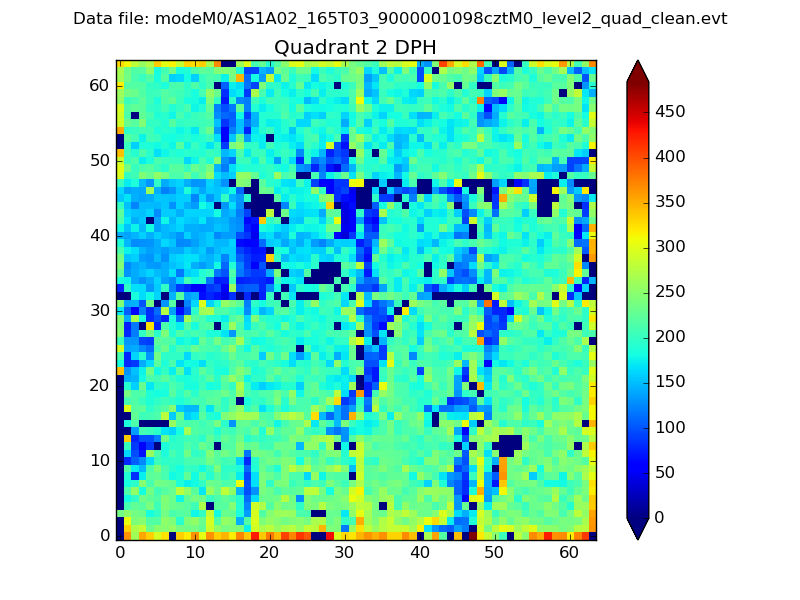 |
Quadrant C |
| Plot type | Count rate plots | Images |
|---|---|---|
| Comparison with Poisson distribution Blue bars denote a histogram of data divided into 1 sec bins. Red curve is a Poisson curve with rate = median count rate of data. |
 |
 |
| Quadrant-wise count rates Data is divided into 100 sec bins |
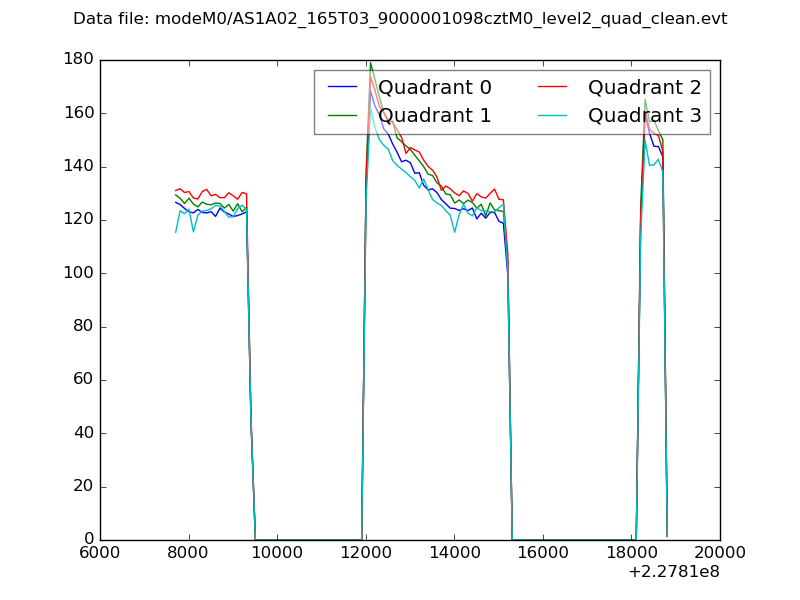 |
|
| Module-wise count rates for Quadrant A Data is divided into 100 sec bins |
 |
 |
| Module-wise count rates for Quadrant B Data is divided into 100 sec bins |
 |
 |
| Module-wise count rates for Quadrant C Data is divided into 100 sec bins |
 |
 |
| Module-wise count rates for Quadrant D Data is divided into 100 sec bins |
 |
 |
| Parameter | Plot |
|---|---|
| CZT HV Monitor |  |
| D_VDD |  |
| Temperature 1 |  |
| Veto HV Monitor |  |
| Veto LLD |  |
| Alpha Counter |  |
| _CPM_Rate |  |
| CZT Counter |  |
| +2.5 Volts monitor | 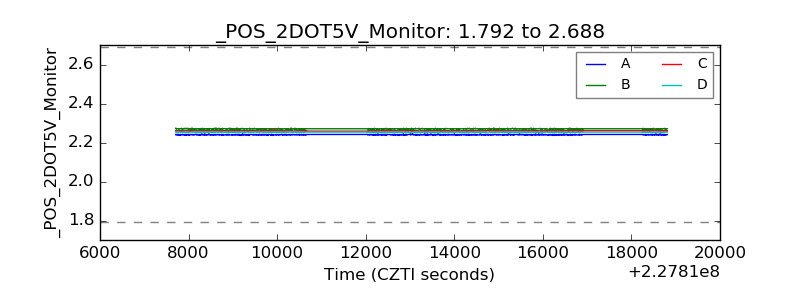 |
| +5 Volts monitor |  |
| _ROLL_ROT |  |
| _Roll_DEC | 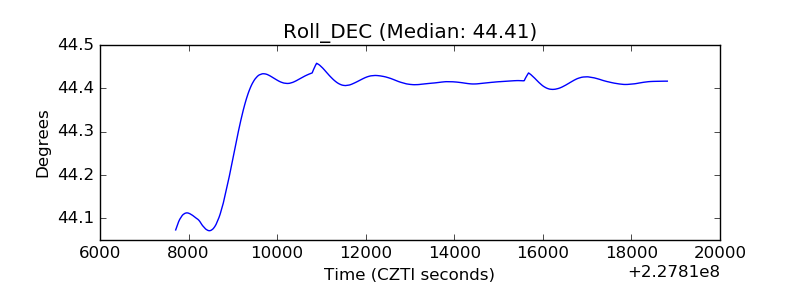 |
| _Roll_RA |  |
| Veto Counter |  |