| Param | Original file | Final file |
|---|---|---|
| Filename | modeM0/AS1G06_168T20_9000001092cztM0_level2.evt | modeM0/AS1G06_168T20_9000001092cztM0_level2_quad_clean.evt |
| Size (bytes) | 511,793,280 | 74,283,840 |
| Size | 488.1 MB | 70.8 MB |
| Events in quadrant A | 3,751,771 | 456,760 |
| Events in quadrant B | 3,800,940 | 466,514 |
| Events in quadrant C | 3,548,511 | 474,850 |
| Events in quadrant D | 4,008,422 | 448,872 |
| Mode M0 | |||
|---|---|---|---|
| Quadrant | BADHDUFLAG | Total packets | Discarded packets |
| A | 0 | 15130 | 0 |
| B | 0 | 15267 | 0 |
| C | 0 | 14387 | 0 |
| D | 0 | 15890 | 0 |
| Mode SS | |||
|---|---|---|---|
| Quadrant | BADHDUFLAG | Total packets | Discarded packets |
| A | 0 | 120 | 0 |
| B | 0 | 120 | 0 |
| C | 0 | 120 | 0 |
| D | 0 | 120 | 0 |
| Mode M9 | |||
|---|---|---|---|
| Quadrant | BADHDUFLAG | Total packets | Discarded packets |
| A | 0 | 23 | 0 |
| B | 0 | 23 | 0 |
| C | 0 | 23 | 0 |
| D | 0 | 23 | 0 |
| Quadrant | Total seconds | Saturated seconds | Saturation percentage |
|---|---|---|---|
| A | 5752 | 71 | 1.234353% |
| B | 5752 | 365 | 6.345619% |
| C | 5752 | 99 | 1.721140% |
| D | 5752 | 235 | 4.085535% |
Noise dominated data is calculated using 1-second bins in cleaned event files. If a bin has >2000 counts, and if more than 50% of those come from <1% of pixels, then it is considered to be noise-dominated and hence unusable.
| Quadrant | # 1 sec bins | Bins with >0 counts | Bins with >2000 counts | High rate bins dominated by noise | Noise dominated (total time) | Noise dominated (detector-on time) | Marked lightcurve |
|---|---|---|---|---|---|---|---|
| A | 8093 | 5754 | 1 | 1 | 0.01% | 0.02% | 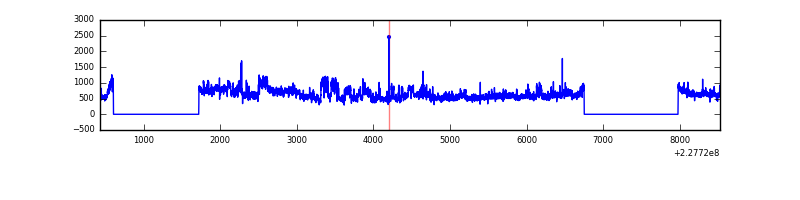 |
| B | 8093 | 5754 | 202 | 202 | 2.50% | 3.51% |  |
| C | 8093 | 5754 | 4 | 4 | 0.05% | 0.07% | 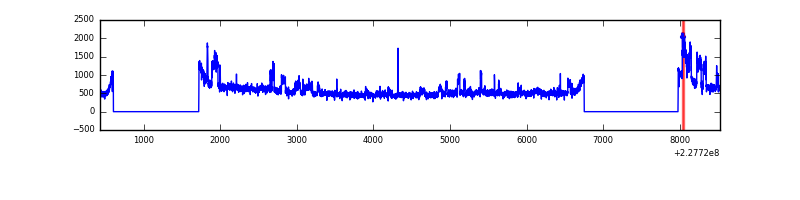 |
| D | 8093 | 5754 | 151 | 151 | 1.87% | 2.62% |  |
Top three noisy pixels from each quadrant. If the there are fewer than three noisy pixels in the level2.evt file, extra rows are filled as -1
| Pixel properties | Quadrant properties | ||||||
|---|---|---|---|---|---|---|---|
| Quadrant | DetID | PixID | Counts | Sigma | Mean | Median | Sigma |
| A | 0 | 128 | 962878 | 6581.1 | 718 | 702 | 146.2 |
| A | 4 | 2 | 7817 | 48.66 | 718 | 702 | 146.2 |
| A | 15 | 239 | 7440 | 46.08 | 718 | 702 | 146.2 |
| B | 5 | 250 | 826056 | 5969.99 | 720 | 703 | 138.3 |
| B | 4 | 239 | 83103 | 596.02 | 720 | 703 | 138.3 |
| B | 0 | 231 | 47475 | 338.31 | 720 | 703 | 138.3 |
| C | 1 | 16 | 739376 | 4451.53 | 716 | 720 | 165.9 |
| C | 10 | 22 | 10808 | 60.8 | 716 | 720 | 165.9 |
| C | 13 | 61 | 5387 | 28.13 | 716 | 720 | 165.9 |
| D | 1 | 52 | 1301603 | 7554.08 | 706 | 687 | 172.2 |
| D | 13 | 169 | 31339 | 177.99 | 706 | 687 | 172.2 |
| D | 2 | 234 | 16953 | 94.45 | 706 | 687 | 172.2 |
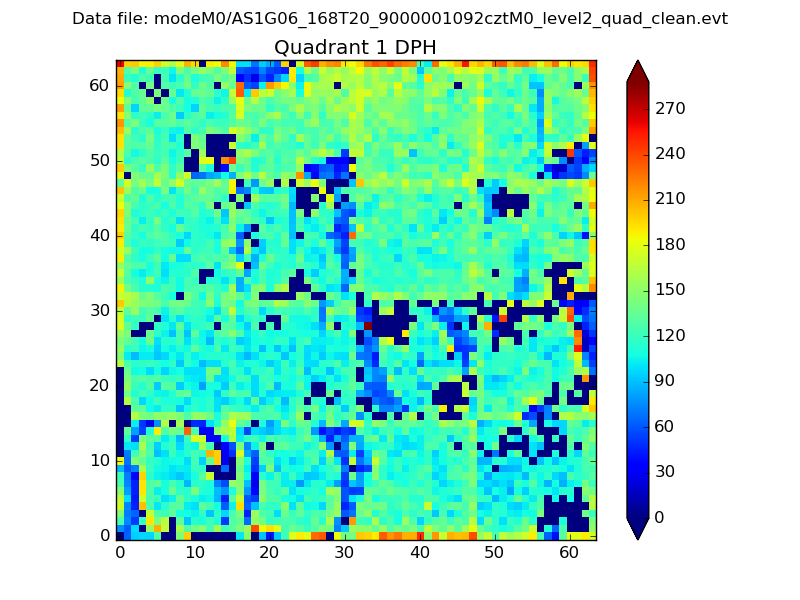
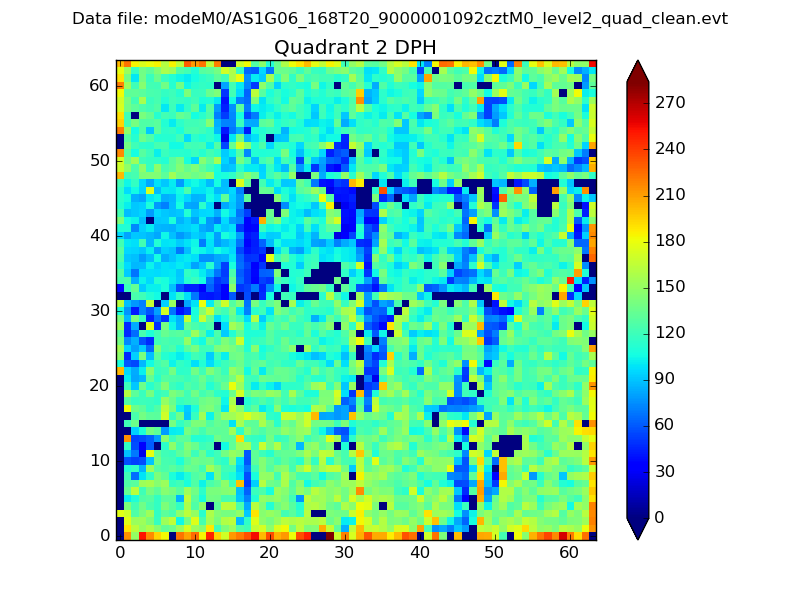
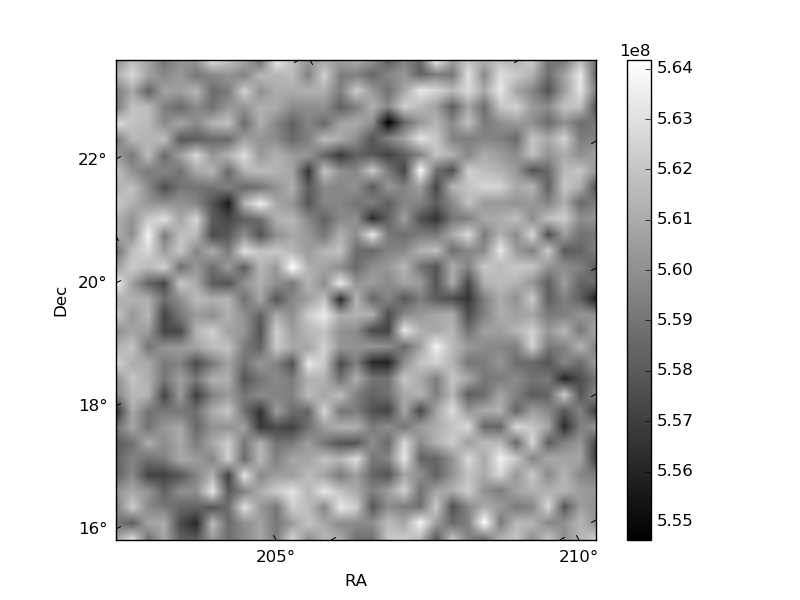
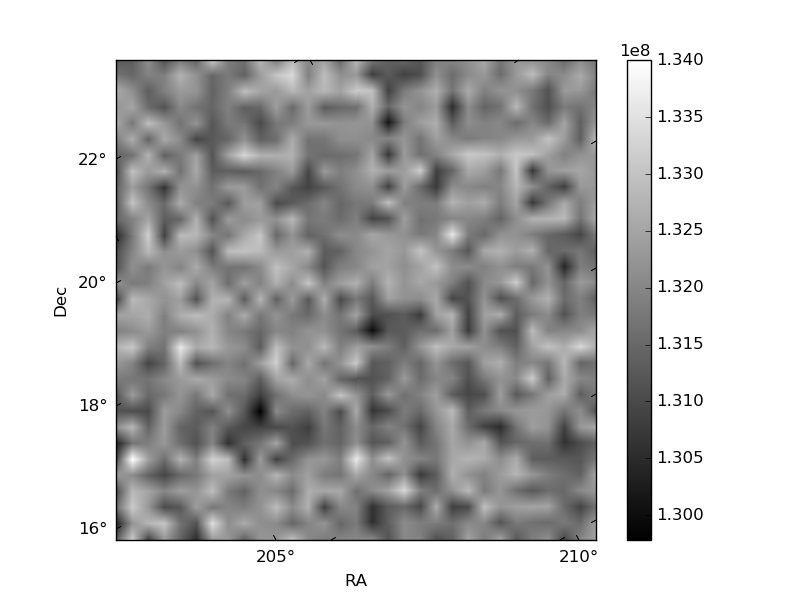
Histogram calculated using DETX and DETY for each event in the final _common_clean file
| Quadrant A |  |
 |
Quadrant B |
|---|---|---|---|
| Quadrant D |  |
 |
Quadrant C |
| Plot type | Count rate plots | Images |
|---|---|---|
| Comparison with Poisson distribution Blue bars denote a histogram of data divided into 1 sec bins. Red curve is a Poisson curve with rate = median count rate of data. |
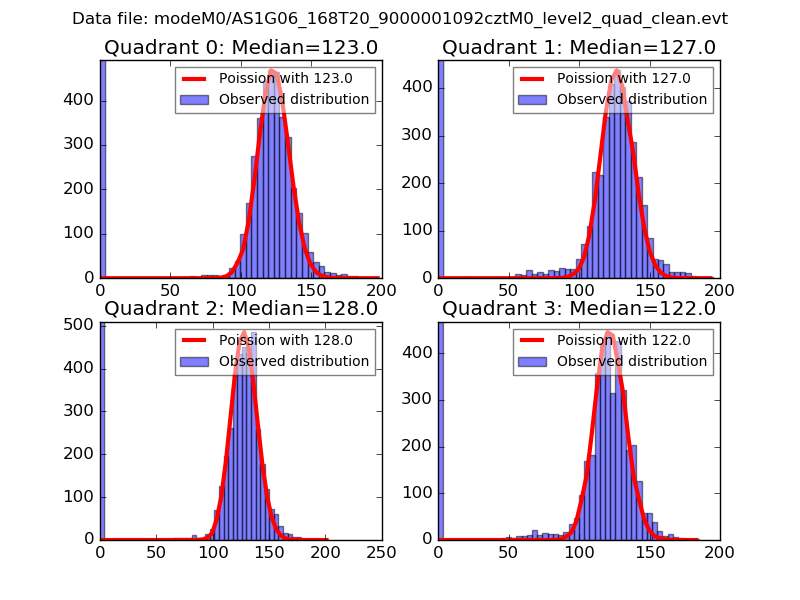 |
 |
| Quadrant-wise count rates Data is divided into 100 sec bins |
 |
|
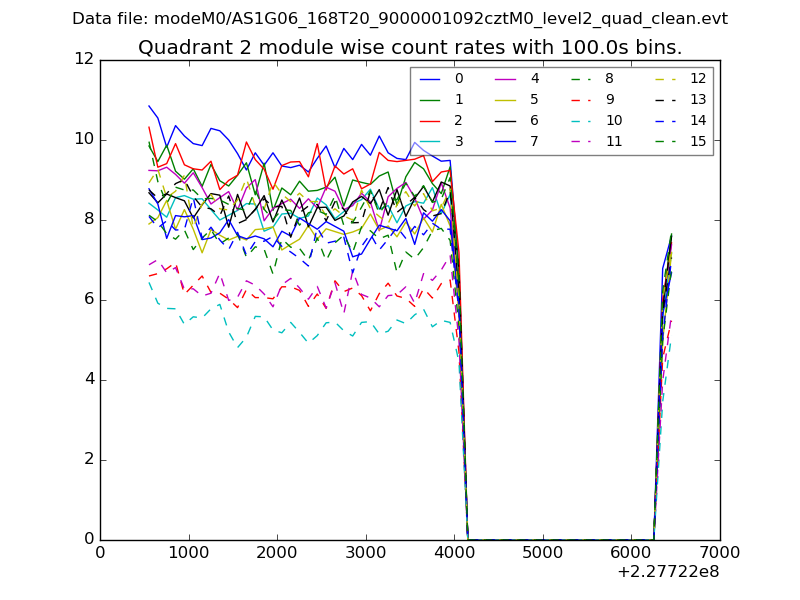
| Module-wise count rates for Quadrant A Data is divided into 100 sec bins |
 |
 |
| Module-wise count rates for Quadrant B Data is divided into 100 sec bins |
 |
 |
| Module-wise count rates for Quadrant C Data is divided into 100 sec bins |
 |
 |
| Module-wise count rates for Quadrant D Data is divided into 100 sec bins |
 |
 |
| Parameter | Plot |
|---|---|
| CZT HV Monitor | 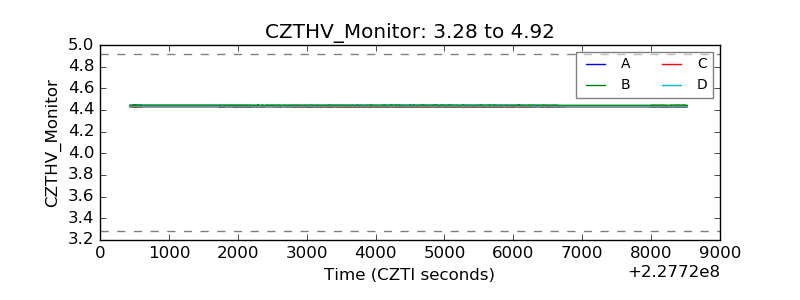 |
| D_VDD |  |
| Temperature 1 | 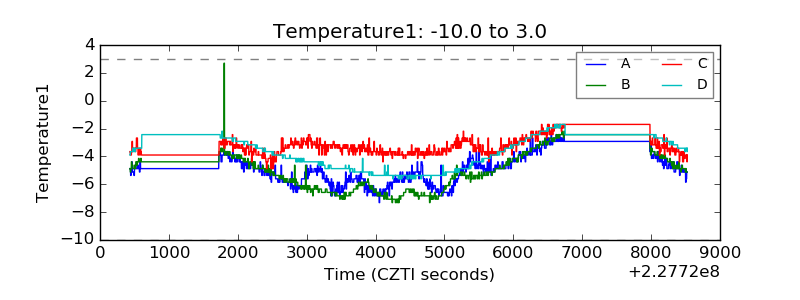 |
| Veto HV Monitor | 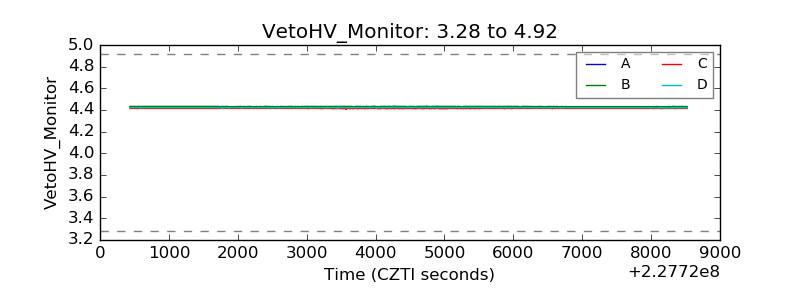 |
| Veto LLD |  |
| Alpha Counter |  |
| _CPM_Rate |  |
| CZT Counter |  |
| +2.5 Volts monitor |  |
| +5 Volts monitor |  |
| _ROLL_ROT |  |
| _Roll_DEC |  |
| _Roll_RA |  |
| Veto Counter |  |