| Param | Original file | Final file |
|---|---|---|
| Filename | modeM0/AS1G06_028T01_9000001094cztM0_level2.evt | modeM0/AS1G06_028T01_9000001094cztM0_level2_quad_clean.evt |
| Size (bytes) | 1,906,551,360 | 375,923,520 |
| Size | 1.8 GB | 358.5 MB |
| Events in quadrant A | 14,341,535 | 2,417,483 |
| Events in quadrant B | 12,334,197 | 2,508,166 |
| Events in quadrant C | 12,673,367 | 2,549,972 |
| Events in quadrant D | 16,858,417 | 2,345,997 |
| Mode SS | |||
|---|---|---|---|
| Quadrant | BADHDUFLAG | Total packets | Discarded packets |
| A | 0 | 462 | 0 |
| B | 0 | 462 | 0 |
| C | 0 | 462 | 0 |
| D | 0 | 462 | 0 |
| Mode M9 | |||
|---|---|---|---|
| Quadrant | BADHDUFLAG | Total packets | Discarded packets |
| A | 0 | 52 | 0 |
| B | 0 | 52 | 0 |
| C | 0 | 52 | 0 |
| D | 0 | 52 | 0 |
| Mode M0 | |||
|---|---|---|---|
| Quadrant | BADHDUFLAG | Total packets | Discarded packets |
| A | 0 | 57968 | 0 |
| B | 0 | 51767 | 0 |
| C | 0 | 52530 | 0 |
| D | 0 | 65518 | 0 |
| Quadrant | Total seconds | Saturated seconds | Saturation percentage |
|---|---|---|---|
| A | 22746 | 510 | 2.242152% |
| B | 22746 | 540 | 2.374044% |
| C | 22746 | 395 | 1.736569% |
| D | 22746 | 1686 | 7.412292% |
Noise dominated data is calculated using 1-second bins in cleaned event files. If a bin has >2000 counts, and if more than 50% of those come from <1% of pixels, then it is considered to be noise-dominated and hence unusable.
| Quadrant | # 1 sec bins | Bins with >0 counts | Bins with >2000 counts | High rate bins dominated by noise | Noise dominated (total time) | Noise dominated (detector-on time) | Marked lightcurve |
|---|---|---|---|---|---|---|---|
| A | 27876 | 22750 | 93 | 93 | 0.33% | 0.41% |  |
| B | 27876 | 22750 | 150 | 150 | 0.54% | 0.66% |  |
| C | 27876 | 22750 | 77 | 77 | 0.28% | 0.34% | 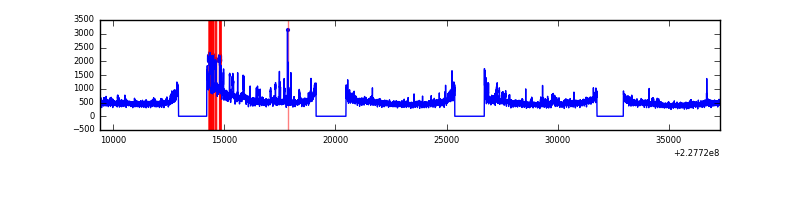 |
| D | 27876 | 22750 | 1205 | 1205 | 4.32% | 5.30% |  |
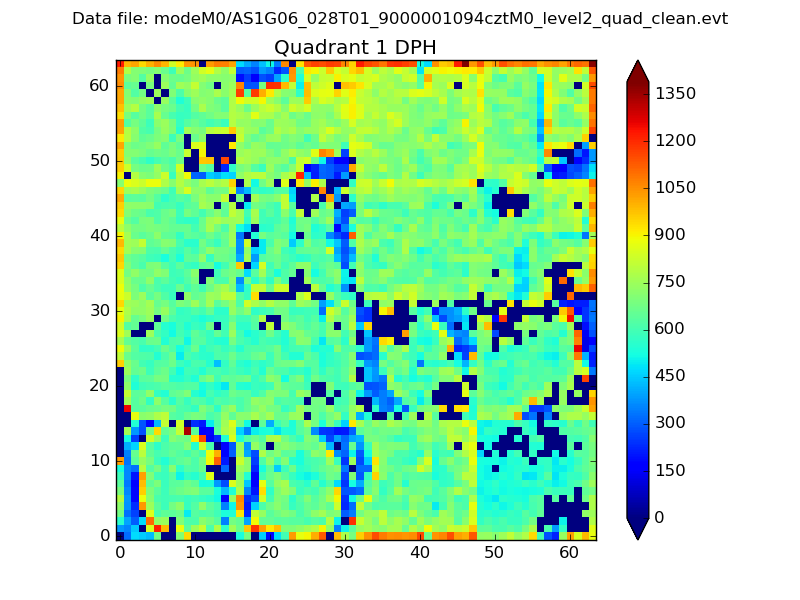
Top three noisy pixels from each quadrant. If the there are fewer than three noisy pixels in the level2.evt file, extra rows are filled as -1
| Pixel properties | Quadrant properties | ||||||
|---|---|---|---|---|---|---|---|
| Quadrant | DetID | PixID | Counts | Sigma | Mean | Median | Sigma |
| A | 0 | 128 | 2513732 | 4460.23 | 2803 | 2752 | 563.0 |
| A | 15 | 239 | 654842 | 1158.3 | 2803 | 2752 | 563.0 |
| A | 4 | 2 | 309751 | 545.32 | 2803 | 2752 | 563.0 |
| B | 4 | 239 | 706537 | 1334.15 | 2845 | 2786 | 527.5 |
| B | 5 | 250 | 212214 | 397.03 | 2845 | 2786 | 527.5 |
| B | 11 | 51 | 144469 | 268.6 | 2845 | 2786 | 527.5 |
| C | 1 | 16 | 1702440 | 2650.13 | 2805 | 2838 | 641.3 |
| C | 8 | 143 | 22724 | 31.01 | 2805 | 2838 | 641.3 |
| C | 13 | 61 | 21223 | 28.67 | 2805 | 2838 | 641.3 |
| D | 1 | 83 | 4417344 | 6127.27 | 2677 | 2632 | 720.5 |
| D | 1 | 52 | 1679850 | 2327.85 | 2677 | 2632 | 720.5 |
| D | 12 | 233 | 224592 | 308.06 | 2677 | 2632 | 720.5 |
Histogram calculated using DETX and DETY for each event in the final _common_clean file
| Quadrant A |  |
 |
Quadrant B |
|---|---|---|---|
| Quadrant D |  |
 |
Quadrant C |
| Plot type | Count rate plots | Images |
|---|---|---|
| Comparison with Poisson distribution Blue bars denote a histogram of data divided into 1 sec bins. Red curve is a Poisson curve with rate = median count rate of data. |
 |
 |
| Quadrant-wise count rates Data is divided into 100 sec bins |
 |
|
| Module-wise count rates for Quadrant A Data is divided into 100 sec bins |
 |
 |
| Module-wise count rates for Quadrant B Data is divided into 100 sec bins |
 |
 |
| Module-wise count rates for Quadrant C Data is divided into 100 sec bins |
 |
 |
| Module-wise count rates for Quadrant D Data is divided into 100 sec bins |
 |
 |
| Parameter | Plot |
|---|---|
| CZT HV Monitor |  |
| D_VDD | 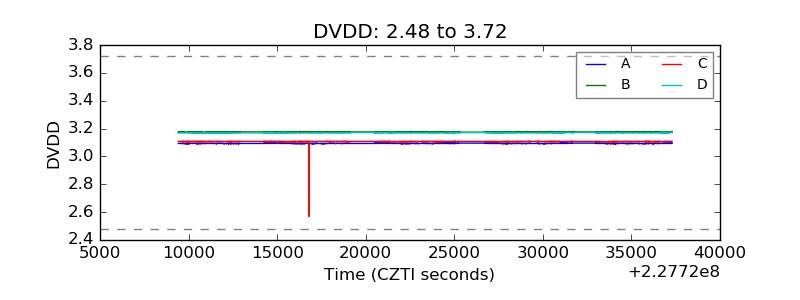 |
| Temperature 1 |  |
| Veto HV Monitor | 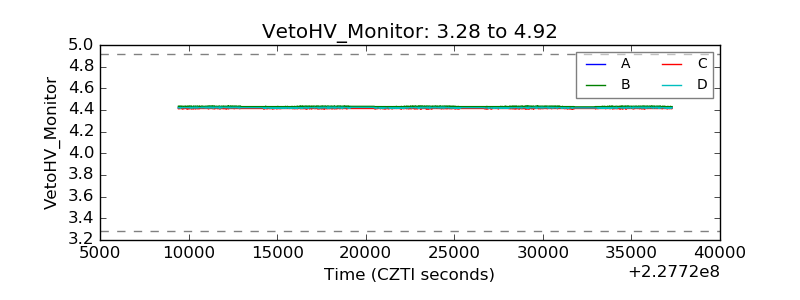 |
| Veto LLD |  |
| Alpha Counter |  |
| _CPM_Rate |  |
| CZT Counter |  |
| +2.5 Volts monitor |  |
| +5 Volts monitor |  |
| _ROLL_ROT | 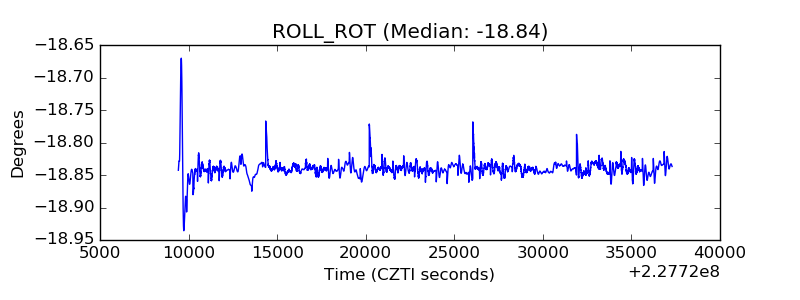 |
| _Roll_DEC |  |
| _Roll_RA |  |
| Veto Counter | 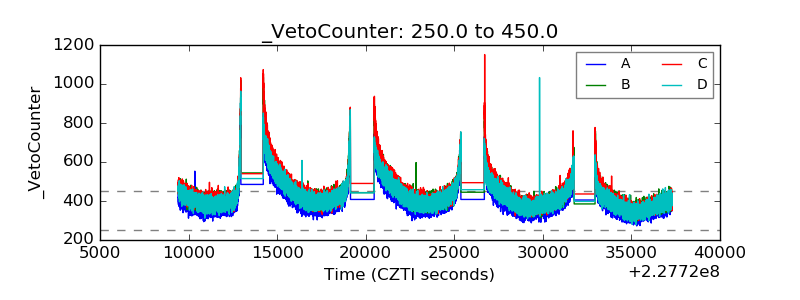 |