| Param | Original file | Final file |
|---|---|---|
| Filename | modeM0/AS1G06_077T01_9000001090cztM0_level2.evt | modeM0/AS1G06_077T01_9000001090cztM0_level2_quad_clean.evt |
| Size (bytes) | 12,127,040,640 | 1,922,201,280 |
| Size | 11.3 GB | 1.8 GB |
| Events in quadrant A | 93,522,082 | 11,652,743 |
| Events in quadrant B | 73,477,973 | 12,488,143 |
| Events in quadrant C | 90,622,455 | 12,116,543 |
| Events in quadrant D | 99,370,565 | 11,511,950 |
| Mode M0 | |||
|---|---|---|---|
| Quadrant | BADHDUFLAG | Total packets | Discarded packets |
| A | 0 | 381224 | 0 |
| B | 0 | 320845 | 0 |
| C | 0 | 373015 | 0 |
| D | 0 | 402210 | 0 |
| Mode M9 | |||
|---|---|---|---|
| Quadrant | BADHDUFLAG | Total packets | Discarded packets |
| A | 0 | 231 | 0 |
| B | 0 | 231 | 0 |
| C | 0 | 231 | 0 |
| D | 0 | 231 | 0 |
| Mode SS | |||
|---|---|---|---|
| Quadrant | BADHDUFLAG | Total packets | Discarded packets |
| A | 0 | 3104 | 0 |
| B | 0 | 3098 | 0 |
| C | 0 | 3108 | 0 |
| D | 0 | 3104 | 0 |
| Quadrant | Total seconds | Saturated seconds | Saturation percentage |
|---|---|---|---|
| A | 152498 | 10492 | 6.880090% |
| B | 152473 | 2772 | 1.818027% |
| C | 152499 | 7065 | 4.632817% |
| D | 152465 | 10983 | 7.203621% |
Noise dominated data is calculated using 1-second bins in cleaned event files. If a bin has >2000 counts, and if more than 50% of those come from <1% of pixels, then it is considered to be noise-dominated and hence unusable.
| Quadrant | # 1 sec bins | Bins with >0 counts | Bins with >2000 counts | High rate bins dominated by noise | Noise dominated (total time) | Noise dominated (detector-on time) | Marked lightcurve |
|---|---|---|---|---|---|---|---|
| A | 175898 | 152791 | 6860 | 6860 | 3.90% | 4.49% |  |
| B | 175899 | 152796 | 156 | 156 | 0.09% | 0.10% |  |
| C | 175899 | 152796 | 4719 | 4719 | 2.68% | 3.09% | 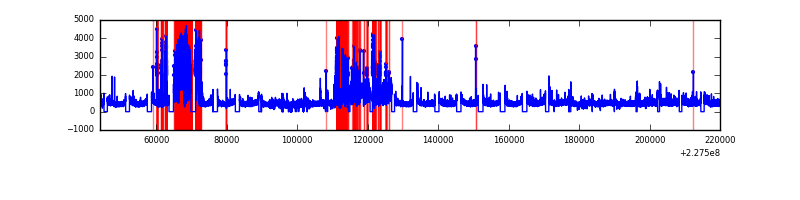 |
| D | 175899 | 152779 | 7828 | 7828 | 4.45% | 5.12% |  |
Top three noisy pixels from each quadrant. If the there are fewer than three noisy pixels in the level2.evt file, extra rows are filled as -1
| Pixel properties | Quadrant properties | ||||||
|---|---|---|---|---|---|---|---|
| Quadrant | DetID | PixID | Counts | Sigma | Mean | Median | Sigma |
| A | 0 | 128 | 19727976 | 5585.49 | 17559 | 17200 | 3528.9 |
| A | 0 | 254 | 3232108 | 911.02 | 17559 | 17200 | 3528.9 |
| A | 4 | 2 | 1345502 | 376.4 | 17559 | 17200 | 3528.9 |
| B | 5 | 255 | 500573 | 138.72 | 18326 | 17867 | 3479.7 |
| B | 5 | 250 | 456715 | 126.12 | 18326 | 17867 | 3479.7 |
| B | 4 | 239 | 432831 | 119.25 | 18326 | 17867 | 3479.7 |
| C | 9 | 68 | 19326779 | 4800.94 | 17495 | 17576 | 4022.0 |
| C | 1 | 16 | 2752336 | 679.96 | 17495 | 17576 | 4022.0 |
| C | 8 | 208 | 157270 | 34.73 | 17495 | 17576 | 4022.0 |
| D | 1 | 52 | 24624227 | 5758.55 | 17188 | 16739 | 4273.2 |
| D | 4 | 95 | 4550706 | 1061.02 | 17188 | 16739 | 4273.2 |
| D | 2 | 14 | 1205479 | 278.18 | 17188 | 16739 | 4273.2 |
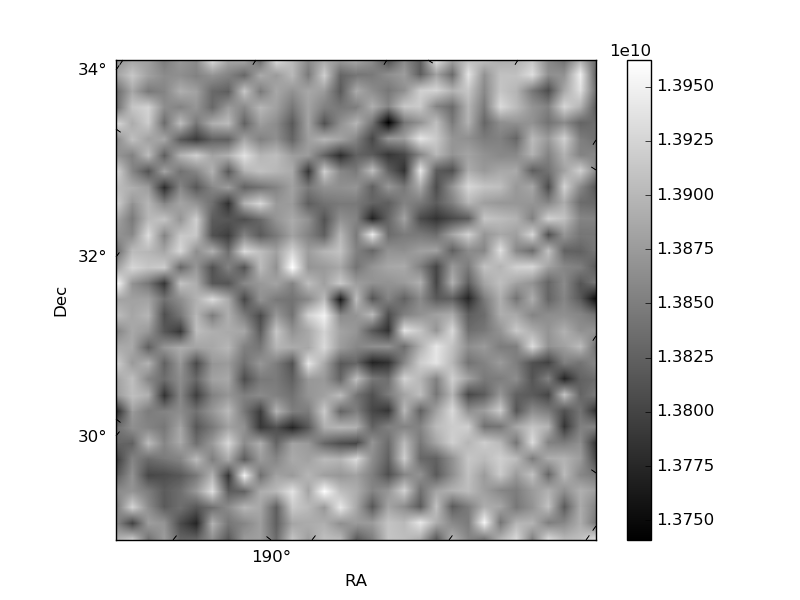
Histogram calculated using DETX and DETY for each event in the final _common_clean file
| Quadrant A |  |
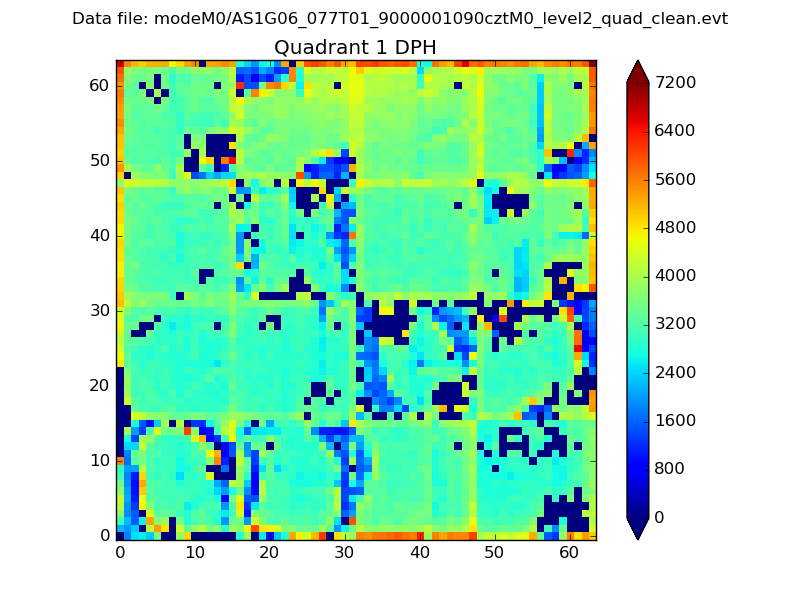 |
Quadrant B |
|---|---|---|---|
| Quadrant D |  |
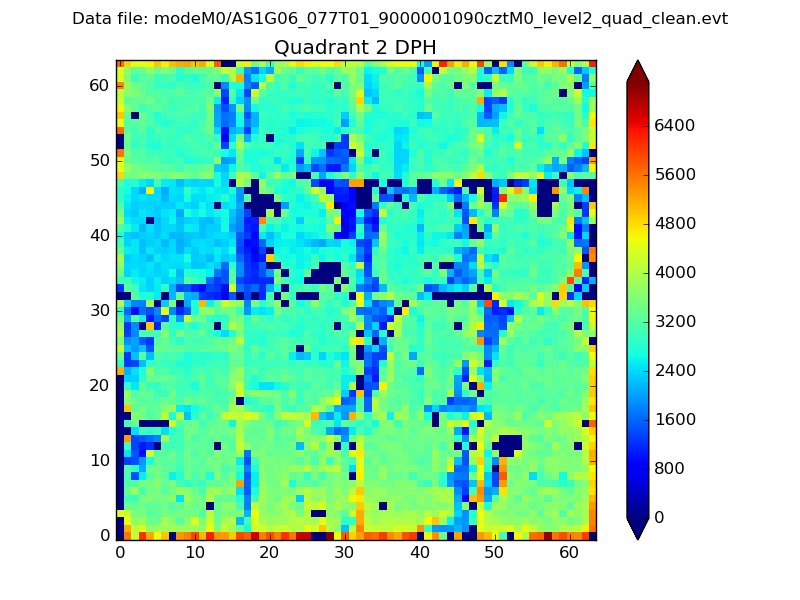 |
Quadrant C |
| Plot type | Count rate plots | Images |
|---|---|---|
| Comparison with Poisson distribution Blue bars denote a histogram of data divided into 1 sec bins. Red curve is a Poisson curve with rate = median count rate of data. |
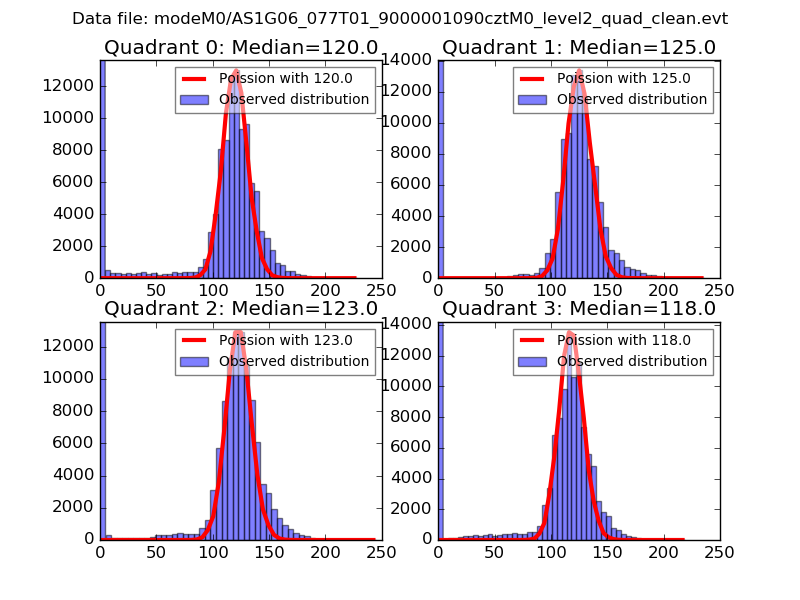 |
 |
| Quadrant-wise count rates Data is divided into 100 sec bins |
 |
|
| Module-wise count rates for Quadrant A Data is divided into 100 sec bins |
 |
 |
| Module-wise count rates for Quadrant B Data is divided into 100 sec bins |
 |
 |
| Module-wise count rates for Quadrant C Data is divided into 100 sec bins |
 |
 |
| Module-wise count rates for Quadrant D Data is divided into 100 sec bins |
 |
 |
| Parameter | Plot |
|---|---|
| CZT HV Monitor |  |
| D_VDD |  |
| Temperature 1 |  |
| Veto HV Monitor |  |
| Veto LLD |  |
| Alpha Counter |  |
| _CPM_Rate |  |
| CZT Counter |  |
| +2.5 Volts monitor |  |
| +5 Volts monitor |  |
| _ROLL_ROT | 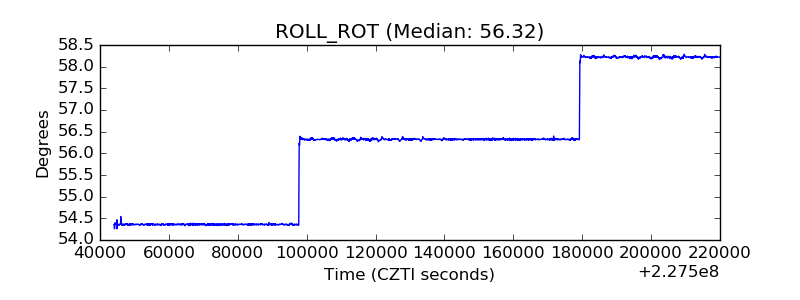 |
| _Roll_DEC |  |
| _Roll_RA | 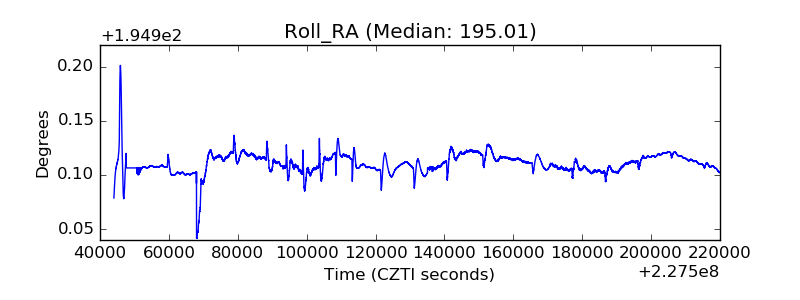 |
| Veto Counter |  |