| Param | Original file | Final file |
|---|---|---|
| Filename | modeM0/AS1G06_071T01_9000001088cztM0_level2.evt | modeM0/AS1G06_071T01_9000001088cztM0_level2_quad_clean.evt |
| Size (bytes) | 1,130,785,920 | 177,958,080 |
| Size | 1.1 GB | 169.7 MB |
| Events in quadrant A | 7,804,382 | 1,083,121 |
| Events in quadrant B | 8,368,426 | 1,096,322 |
| Events in quadrant C | 7,469,890 | 1,086,491 |
| Events in quadrant D | 9,522,571 | 1,021,239 |
| Mode M9 | |||
|---|---|---|---|
| Quadrant | BADHDUFLAG | Total packets | Discarded packets |
| A | 0 | 15 | 0 |
| B | 0 | 15 | 0 |
| C | 0 | 15 | 0 |
| D | 0 | 15 | 0 |
| Mode M0 | |||
|---|---|---|---|
| Quadrant | BADHDUFLAG | Total packets | Discarded packets |
| A | 0 | 34072 | 0 |
| B | 0 | 35314 | 0 |
| C | 0 | 33174 | 0 |
| D | 0 | 39217 | 0 |
| Mode SS | |||
|---|---|---|---|
| Quadrant | BADHDUFLAG | Total packets | Discarded packets |
| A | 0 | 328 | 0 |
| B | 0 | 328 | 0 |
| C | 0 | 328 | 0 |
| D | 0 | 328 | 0 |
| Quadrant | Total seconds | Saturated seconds | Saturation percentage |
|---|---|---|---|
| A | 15967 | 369 | 2.311016% |
| B | 15968 | 409 | 2.561373% |
| C | 15966 | 211 | 1.321558% |
| D | 15962 | 571 | 3.577246% |
Noise dominated data is calculated using 1-second bins in cleaned event files. If a bin has >2000 counts, and if more than 50% of those come from <1% of pixels, then it is considered to be noise-dominated and hence unusable.
| Quadrant | # 1 sec bins | Bins with >0 counts | Bins with >2000 counts | High rate bins dominated by noise | Noise dominated (total time) | Noise dominated (detector-on time) | Marked lightcurve |
|---|---|---|---|---|---|---|---|
| A | 17594 | 15971 | 55 | 55 | 0.31% | 0.34% | 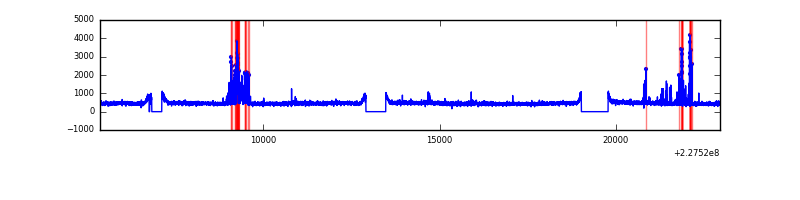 |
| B | 17594 | 15972 | 77 | 77 | 0.44% | 0.48% |  |
| C | 17594 | 15973 | 0 | 0 | 0.00% | 0.00% |  |
| D | 17594 | 15972 | 239 | 239 | 1.36% | 1.50% |  |
Top three noisy pixels from each quadrant. If the there are fewer than three noisy pixels in the level2.evt file, extra rows are filled as -1
| Pixel properties | Quadrant properties | ||||||
|---|---|---|---|---|---|---|---|
| Quadrant | DetID | PixID | Counts | Sigma | Mean | Median | Sigma |
| A | 15 | 223 | 335402 | 885.66 | 1861 | 1817 | 376.7 |
| A | 13 | 248 | 175234 | 460.42 | 1861 | 1817 | 376.7 |
| A | 8 | 15 | 73599 | 190.58 | 1861 | 1817 | 376.7 |
| B | 4 | 239 | 580059 | 1614.78 | 1874 | 1824 | 358.1 |
| B | 11 | 51 | 205551 | 568.93 | 1874 | 1824 | 358.1 |
| B | 10 | 16 | 190495 | 526.88 | 1874 | 1824 | 358.1 |
| C | 1 | 16 | 331143 | 780.24 | 1826 | 1836 | 422.1 |
| C | 14 | 67 | 14649 | 30.36 | 1826 | 1836 | 422.1 |
| C | 13 | 61 | 13755 | 28.24 | 1826 | 1836 | 422.1 |
| D | 1 | 52 | 1407052 | 3210.58 | 1807 | 1754 | 437.7 |
| D | 13 | 104 | 350290 | 796.27 | 1807 | 1754 | 437.7 |
| D | 7 | 55 | 206461 | 467.68 | 1807 | 1754 | 437.7 |
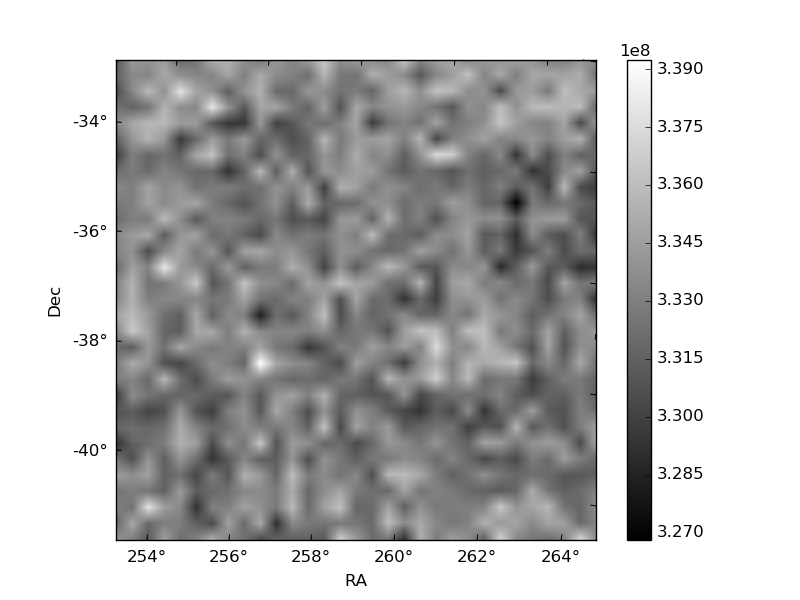
Histogram calculated using DETX and DETY for each event in the final _common_clean file
| Quadrant A |  |
 |
Quadrant B |
|---|---|---|---|
| Quadrant D |  |
 |
Quadrant C |
| Plot type | Count rate plots | Images |
|---|---|---|
| Comparison with Poisson distribution Blue bars denote a histogram of data divided into 1 sec bins. Red curve is a Poisson curve with rate = median count rate of data. |
 |
 |
| Quadrant-wise count rates Data is divided into 100 sec bins |
 |
|
| Module-wise count rates for Quadrant A Data is divided into 100 sec bins |
 |
 |
| Module-wise count rates for Quadrant B Data is divided into 100 sec bins |
 |
 |
| Module-wise count rates for Quadrant C Data is divided into 100 sec bins |
 |
 |
| Module-wise count rates for Quadrant D Data is divided into 100 sec bins |
 |
 |
| Parameter | Plot |
|---|---|
| CZT HV Monitor | 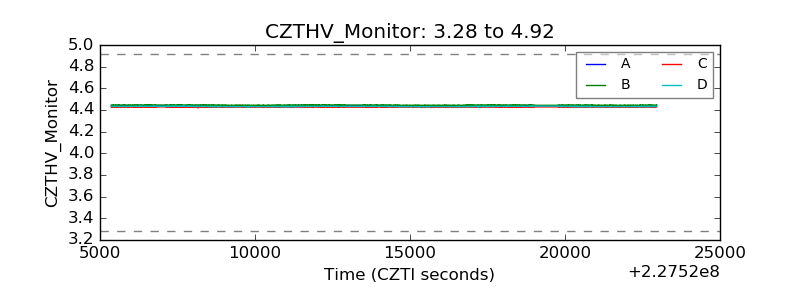 |
| D_VDD |  |
| Temperature 1 |  |
| Veto HV Monitor | 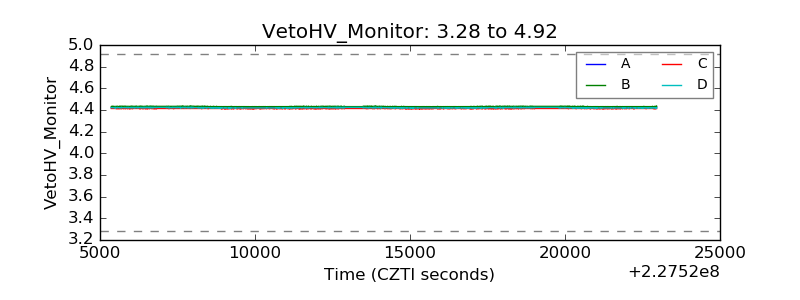 |
| Veto LLD |  |
| Alpha Counter | 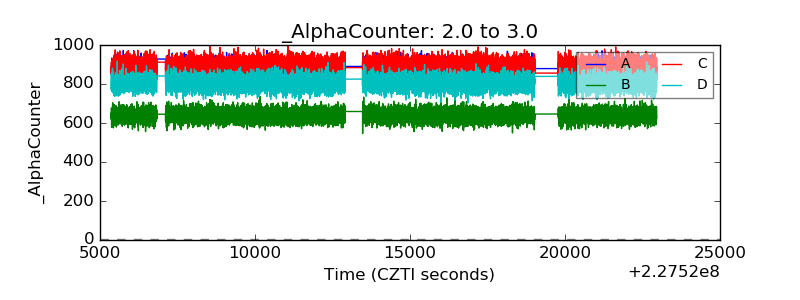 |
| _CPM_Rate |  |
| CZT Counter |  |
| +2.5 Volts monitor |  |
| +5 Volts monitor |  |
| _ROLL_ROT | 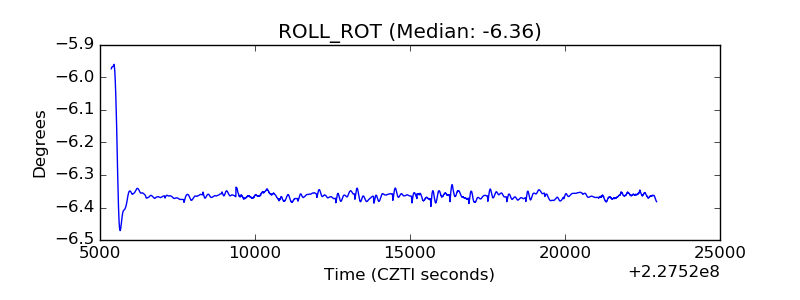 |
| _Roll_DEC |  |
| _Roll_RA |  |
| Veto Counter |  |