| Param | Original file | Final file |
|---|---|---|
| Filename | modeM0/AS1A02_027T01_9000001084cztM0_level2.evt | modeM0/AS1A02_027T01_9000001084cztM0_level2_quad_clean.evt |
| Size (bytes) | 7,026,563,520 | 1,328,025,600 |
| Size | 6.5 GB | 1.2 GB |
| Events in quadrant A | 47,384,044 | 8,231,680 |
| Events in quadrant B | 50,247,302 | 8,510,289 |
| Events in quadrant C | 56,360,003 | 8,568,706 |
| Events in quadrant D | 52,144,783 | 8,141,505 |
| Mode M0 | |||
|---|---|---|---|
| Quadrant | BADHDUFLAG | Total packets | Discarded packets |
| A | 0 | 208359 | 0 |
| B | 0 | 215309 | 0 |
| C | 0 | 234361 | 0 |
| D | 0 | 223259 | 0 |
| Mode M9 | |||
|---|---|---|---|
| Quadrant | BADHDUFLAG | Total packets | Discarded packets |
| A | 0 | 173 | 0 |
| B | 0 | 173 | 0 |
| C | 0 | 173 | 0 |
| D | 0 | 173 | 0 |
| Mode SS | |||
|---|---|---|---|
| Quadrant | BADHDUFLAG | Total packets | Discarded packets |
| A | 0 | 2010 | 0 |
| B | 0 | 2010 | 0 |
| C | 0 | 2011 | 0 |
| D | 0 | 2010 | 0 |
| Quadrant | Total seconds | Saturated seconds | Saturation percentage |
|---|---|---|---|
| A | 98842 | 1459 | 1.476093% |
| B | 98841 | 1915 | 1.937455% |
| C | 98838 | 1974 | 1.997208% |
| D | 98843 | 1727 | 1.747215% |
Noise dominated data is calculated using 1-second bins in cleaned event files. If a bin has >2000 counts, and if more than 50% of those come from <1% of pixels, then it is considered to be noise-dominated and hence unusable.
| Quadrant | # 1 sec bins | Bins with >0 counts | Bins with >2000 counts | High rate bins dominated by noise | Noise dominated (total time) | Noise dominated (detector-on time) | Marked lightcurve |
|---|---|---|---|---|---|---|---|
| A | 116099 | 98891 | 144 | 144 | 0.12% | 0.15% |  |
| B | 116099 | 98892 | 349 | 349 | 0.30% | 0.35% |  |
| C | 116099 | 98888 | 471 | 471 | 0.41% | 0.48% | 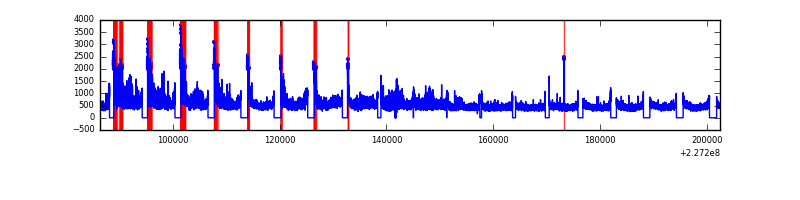 |
| D | 116099 | 98887 | 572 | 572 | 0.49% | 0.58% | 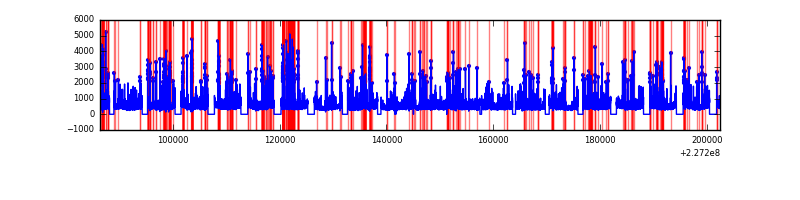 |
Top three noisy pixels from each quadrant. If the there are fewer than three noisy pixels in the level2.evt file, extra rows are filled as -1
| Pixel properties | Quadrant properties | ||||||
|---|---|---|---|---|---|---|---|
| Quadrant | DetID | PixID | Counts | Sigma | Mean | Median | Sigma |
| A | 15 | 239 | 1234370 | 517.06 | 11748 | 11502 | 2365.0 |
| A | 15 | 234 | 727549 | 302.76 | 11748 | 11502 | 2365.0 |
| A | 8 | 15 | 129640 | 49.95 | 11748 | 11502 | 2365.0 |
| B | 4 | 239 | 1463991 | 653.18 | 11889 | 11625 | 2223.5 |
| B | 10 | 16 | 732453 | 324.18 | 11889 | 11625 | 2223.5 |
| B | 11 | 51 | 673289 | 297.57 | 11889 | 11625 | 2223.5 |
| C | 1 | 16 | 11226774 | 4237.42 | 11553 | 11605 | 2646.7 |
| C | 13 | 61 | 88824 | 29.18 | 11553 | 11605 | 2646.7 |
| C | 12 | 4 | 54168 | 16.08 | 11553 | 11605 | 2646.7 |
| D | 1 | 52 | 3829607 | 1364.82 | 11501 | 11148 | 2797.8 |
| D | 5 | 233 | 2007828 | 713.67 | 11501 | 11148 | 2797.8 |
| D | 13 | 104 | 524076 | 183.33 | 11501 | 11148 | 2797.8 |
Histogram calculated using DETX and DETY for each event in the final _common_clean file
| Quadrant A | 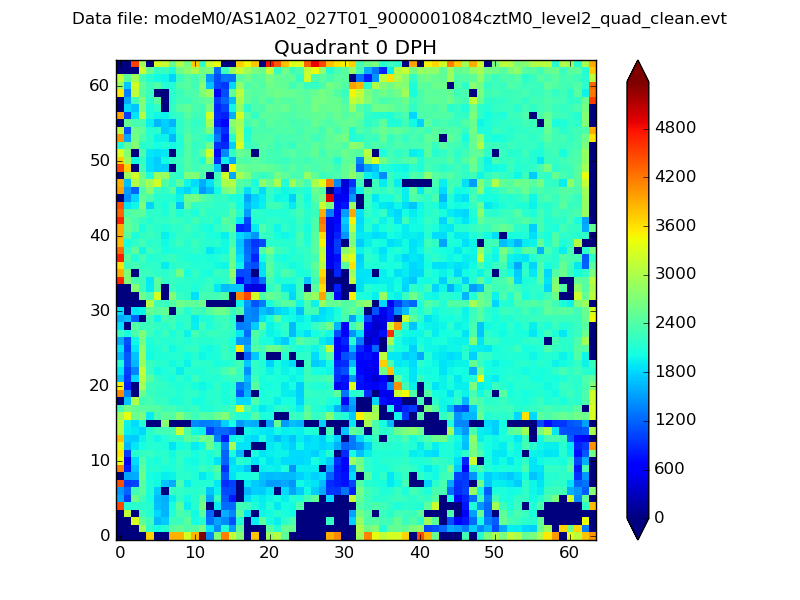 |
 |
Quadrant B |
|---|---|---|---|
| Quadrant D | 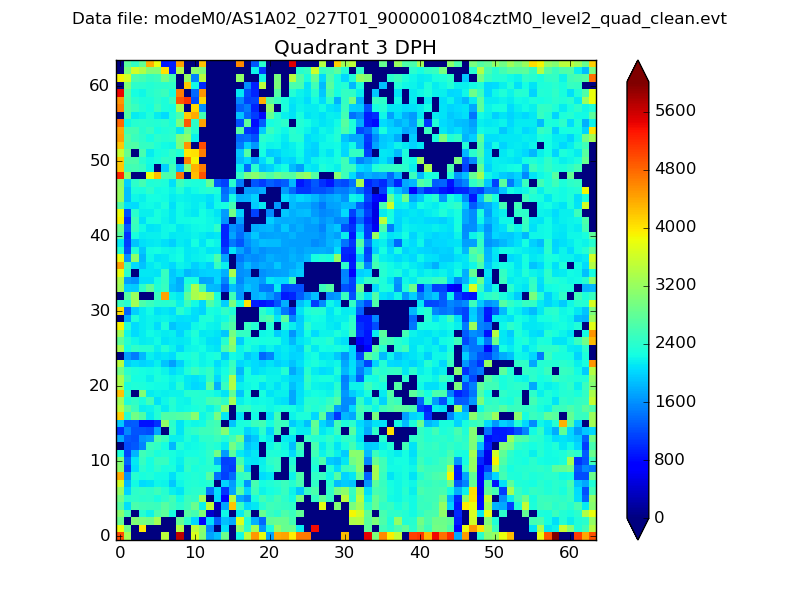 |
 |
Quadrant C |
| Plot type | Count rate plots | Images |
|---|---|---|
| Comparison with Poisson distribution Blue bars denote a histogram of data divided into 1 sec bins. Red curve is a Poisson curve with rate = median count rate of data. |
 |
 |
| Quadrant-wise count rates Data is divided into 100 sec bins |
 |
|
| Module-wise count rates for Quadrant A Data is divided into 100 sec bins |
 |
 |
| Module-wise count rates for Quadrant B Data is divided into 100 sec bins |
 |
 |
| Module-wise count rates for Quadrant C Data is divided into 100 sec bins |
 |
 |
| Module-wise count rates for Quadrant D Data is divided into 100 sec bins |
 |
 |
| Parameter | Plot |
|---|---|
| CZT HV Monitor |  |
| D_VDD |  |
| Temperature 1 | 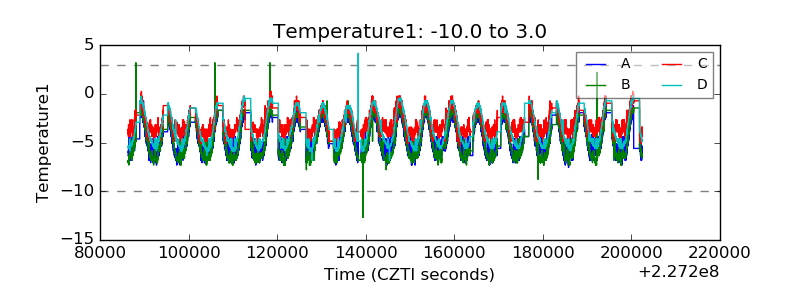 |
| Veto HV Monitor | 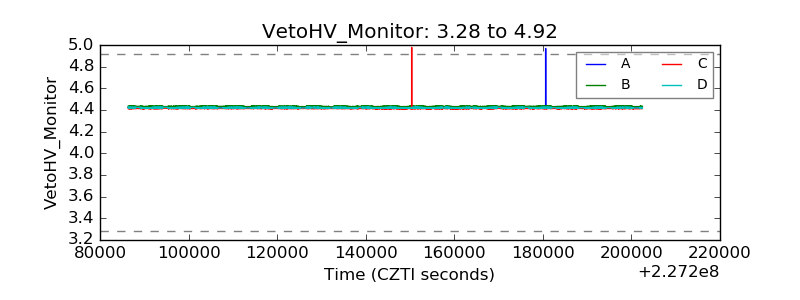 |
| Veto LLD | 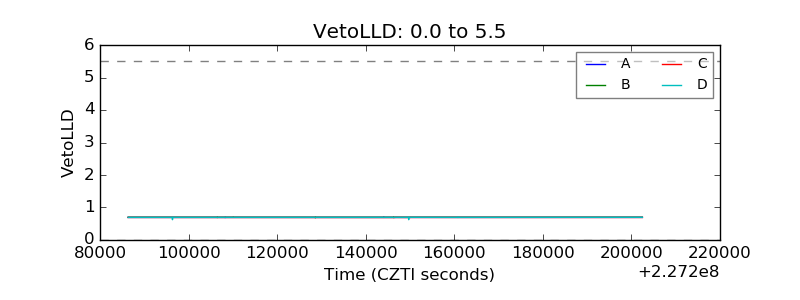 |
| Alpha Counter |  |
| _CPM_Rate | 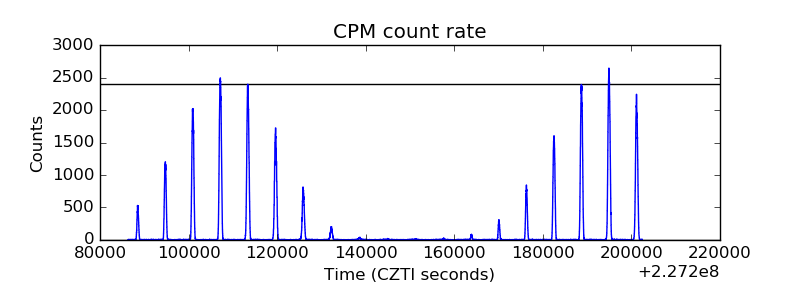 |
| CZT Counter | 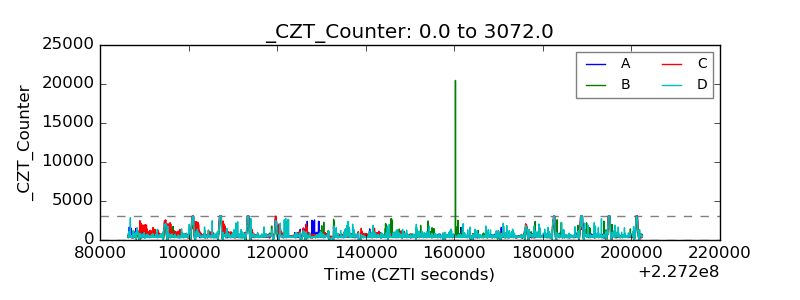 |
| +2.5 Volts monitor | 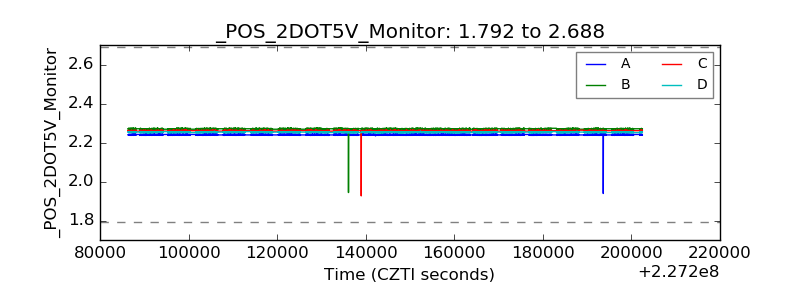 |
| +5 Volts monitor |  |
| _ROLL_ROT | 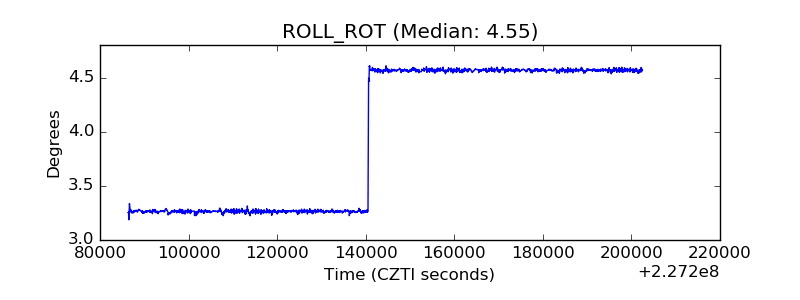 |
| _Roll_DEC | 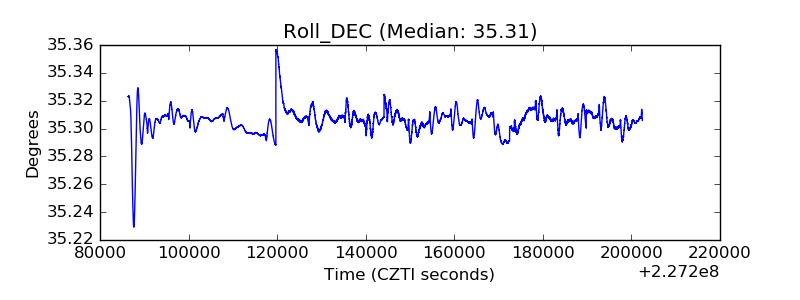 |
| _Roll_RA |  |
| Veto Counter |  |