| Param | Original file | Final file |
|---|---|---|
| Filename | modeM0/AS1A02_158T01_9000001080cztM0_level2.evt | modeM0/AS1A02_158T01_9000001080cztM0_level2_quad_clean.evt |
| Size (bytes) | 2,482,306,560 | 443,594,880 |
| Size | 2.3 GB | 423.0 MB |
| Events in quadrant A | 15,518,511 | 2,828,992 |
| Events in quadrant B | 16,238,047 | 2,886,321 |
| Events in quadrant C | 18,262,507 | 2,845,947 |
| Events in quadrant D | 22,882,677 | 2,558,455 |
| Mode M0 | |||
|---|---|---|---|
| Quadrant | BADHDUFLAG | Total packets | Discarded packets |
| A | 0 | 69441 | 0 |
| B | 0 | 70944 | 0 |
| C | 0 | 76736 | 0 |
| D | 0 | 91545 | 0 |
| Mode SS | |||
|---|---|---|---|
| Quadrant | BADHDUFLAG | Total packets | Discarded packets |
| A | 0 | 686 | 0 |
| B | 0 | 686 | 0 |
| C | 0 | 686 | 0 |
| D | 0 | 686 | 0 |
| Mode M9 | |||
|---|---|---|---|
| Quadrant | BADHDUFLAG | Total packets | Discarded packets |
| A | 0 | 54 | 0 |
| B | 0 | 54 | 0 |
| C | 0 | 54 | 0 |
| D | 0 | 54 | 0 |
| Quadrant | Total seconds | Saturated seconds | Saturation percentage |
|---|---|---|---|
| A | 33711 | 423 | 1.254783% |
| B | 33711 | 468 | 1.388271% |
| C | 33711 | 413 | 1.225119% |
| D | 33711 | 2891 | 8.575836% |
Noise dominated data is calculated using 1-second bins in cleaned event files. If a bin has >2000 counts, and if more than 50% of those come from <1% of pixels, then it is considered to be noise-dominated and hence unusable.
| Quadrant | # 1 sec bins | Bins with >0 counts | Bins with >2000 counts | High rate bins dominated by noise | Noise dominated (total time) | Noise dominated (detector-on time) | Marked lightcurve |
|---|---|---|---|---|---|---|---|
| A | 38536 | 33717 | 12 | 12 | 0.03% | 0.04% |  |
| B | 38536 | 33717 | 32 | 32 | 0.08% | 0.09% | 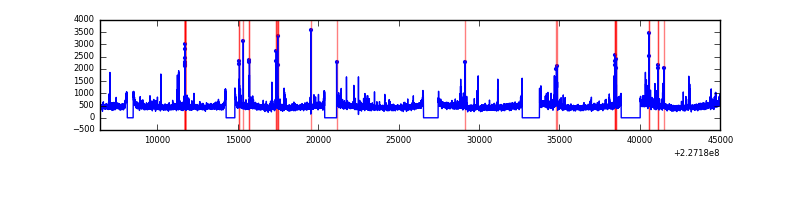 |
| C | 38536 | 33717 | 36 | 36 | 0.09% | 0.11% |  |
| D | 38536 | 33717 | 2524 | 2524 | 6.55% | 7.49% |  |
Top three noisy pixels from each quadrant. If the there are fewer than three noisy pixels in the level2.evt file, extra rows are filled as -1
| Pixel properties | Quadrant properties | ||||||
|---|---|---|---|---|---|---|---|
| Quadrant | DetID | PixID | Counts | Sigma | Mean | Median | Sigma |
| A | 8 | 15 | 73190 | 86.84 | 3962 | 3884 | 798.1 |
| A | 15 | 239 | 56179 | 65.53 | 3962 | 3884 | 798.1 |
| A | 15 | 234 | 51245 | 59.35 | 3962 | 3884 | 798.1 |
| B | 4 | 239 | 232517 | 301.54 | 4004 | 3902 | 758.2 |
| B | 5 | 255 | 158788 | 204.29 | 4004 | 3902 | 758.2 |
| B | 4 | 81 | 119805 | 152.87 | 4004 | 3902 | 758.2 |
| C | 1 | 16 | 2966753 | 3307.74 | 3886 | 3910 | 895.7 |
| C | 9 | 68 | 77308 | 81.94 | 3886 | 3910 | 895.7 |
| C | 14 | 67 | 62767 | 65.71 | 3886 | 3910 | 895.7 |
| D | 1 | 20 | 8027807 | 8805.0 | 3721 | 3603 | 911.3 |
| D | 1 | 52 | 384804 | 418.29 | 3721 | 3603 | 911.3 |
| D | 2 | 234 | 111390 | 118.28 | 3721 | 3603 | 911.3 |
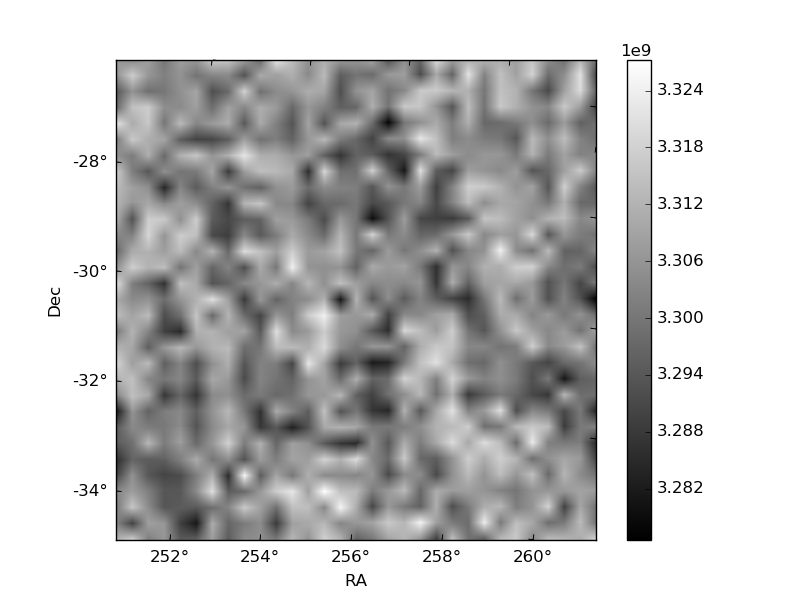
Histogram calculated using DETX and DETY for each event in the final _common_clean file
| Quadrant A |  |
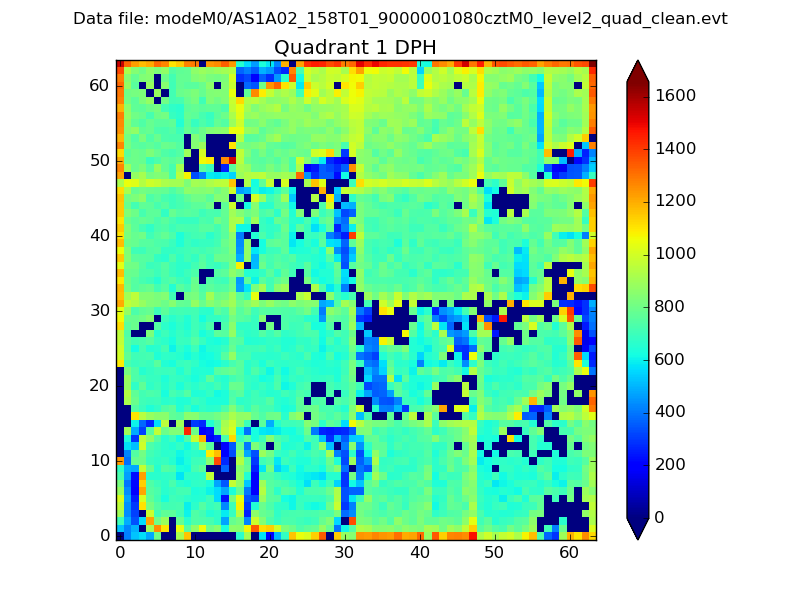 |
Quadrant B |
|---|---|---|---|
| Quadrant D | 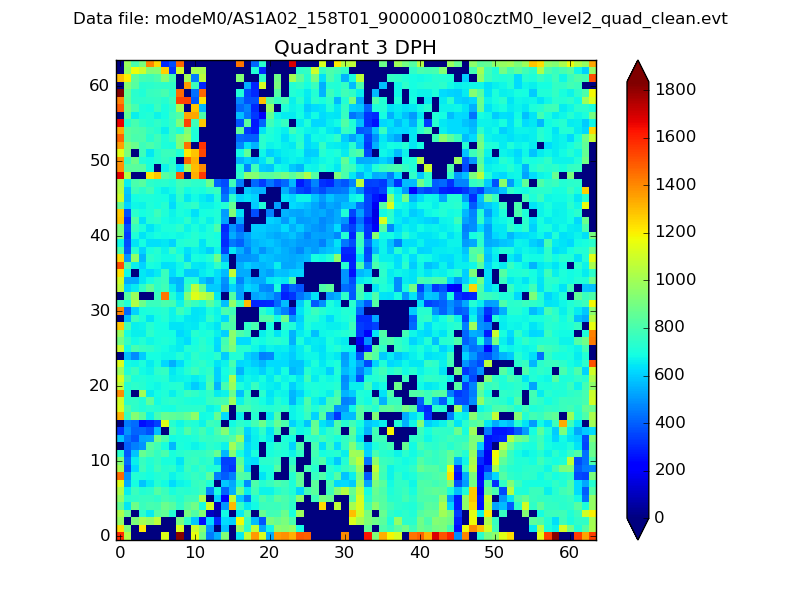 |
 |
Quadrant C |
| Plot type | Count rate plots | Images |
|---|---|---|
| Comparison with Poisson distribution Blue bars denote a histogram of data divided into 1 sec bins. Red curve is a Poisson curve with rate = median count rate of data. |
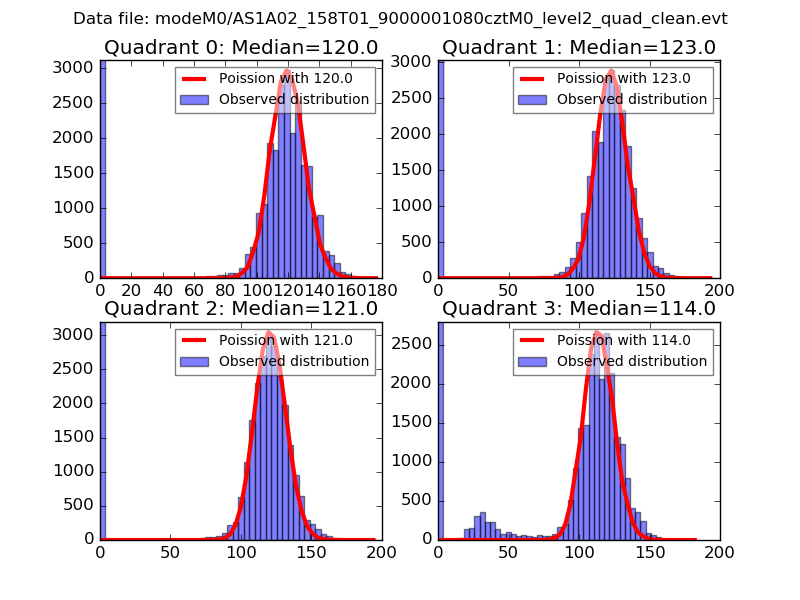 |
 |
| Quadrant-wise count rates Data is divided into 100 sec bins |
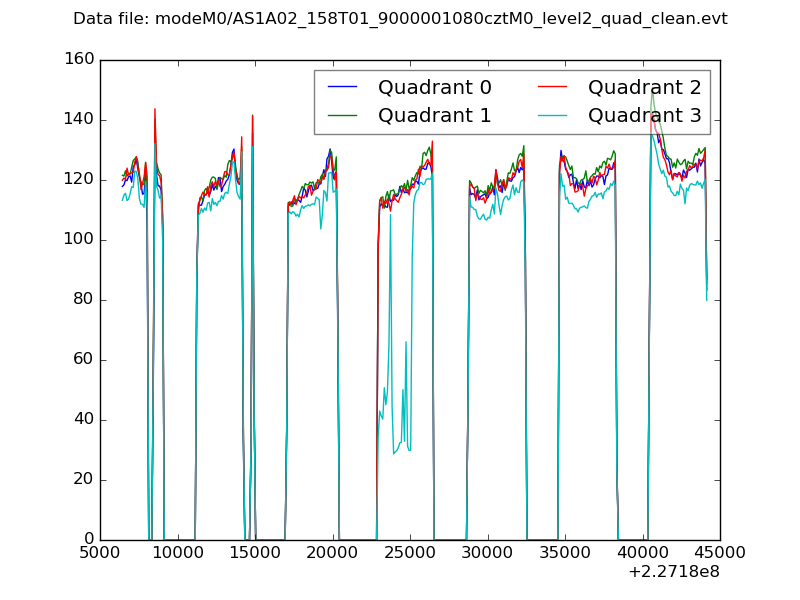 |
|
| Module-wise count rates for Quadrant A Data is divided into 100 sec bins |
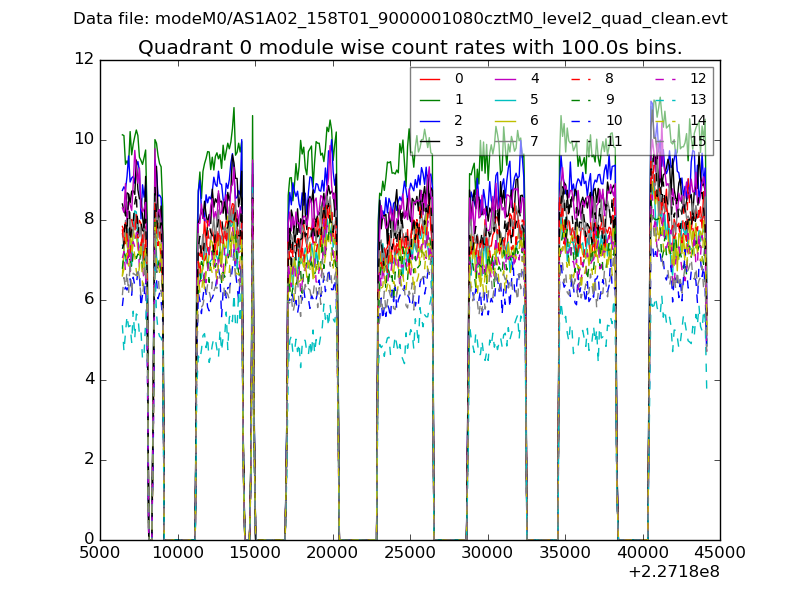 |
 |
| Module-wise count rates for Quadrant B Data is divided into 100 sec bins |
 |
 |
| Module-wise count rates for Quadrant C Data is divided into 100 sec bins |
 |
 |
| Module-wise count rates for Quadrant D Data is divided into 100 sec bins |
 |
 |
| Parameter | Plot |
|---|---|
| CZT HV Monitor | 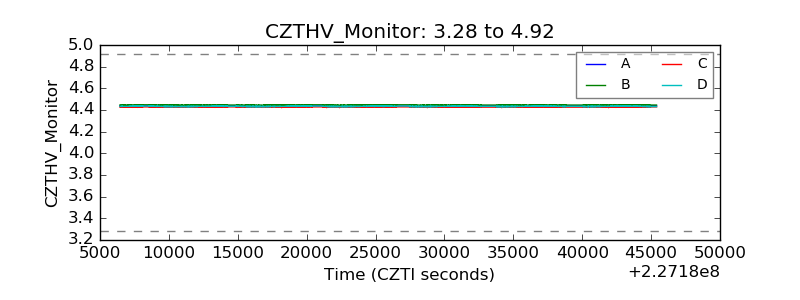 |
| D_VDD |  |
| Temperature 1 |  |
| Veto HV Monitor | 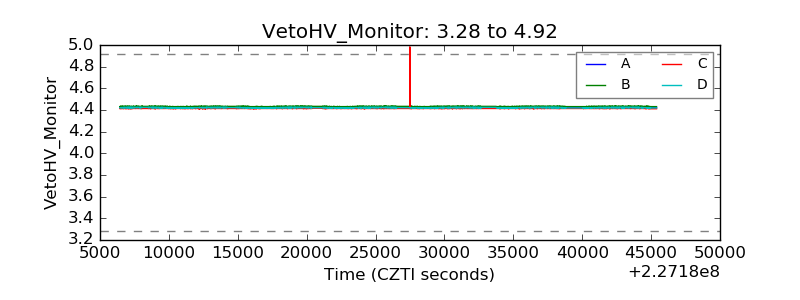 |
| Veto LLD |  |
| Alpha Counter |  |
| _CPM_Rate |  |
| CZT Counter |  |
| +2.5 Volts monitor |  |
| +5 Volts monitor |  |
| _ROLL_ROT |  |
| _Roll_DEC |  |
| _Roll_RA |  |
| Veto Counter | 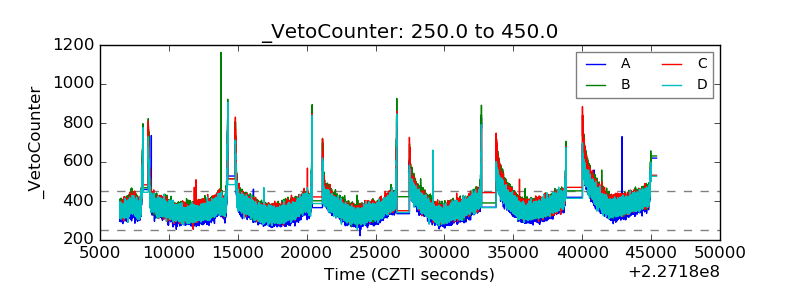 |