| Param | Original file | Final file |
|---|---|---|
| Filename | modeM0/AS1A02_029T01_9000001082cztM0_level2.evt | modeM0/AS1A02_029T01_9000001082cztM0_level2_quad_clean.evt |
| Size (bytes) | 1,169,804,160 | 244,696,320 |
| Size | 1.1 GB | 233.4 MB |
| Events in quadrant A | 7,907,952 | 1,566,640 |
| Events in quadrant B | 8,187,051 | 1,628,890 |
| Events in quadrant C | 10,068,778 | 1,576,872 |
| Events in quadrant D | 8,145,540 | 1,498,525 |
| Mode M9 | |||
|---|---|---|---|
| Quadrant | BADHDUFLAG | Total packets | Discarded packets |
| A | 0 | 42 | 0 |
| B | 0 | 42 | 0 |
| C | 0 | 42 | 0 |
| D | 0 | 42 | 0 |
| Mode M0 | |||
|---|---|---|---|
| Quadrant | BADHDUFLAG | Total packets | Discarded packets |
| A | 0 | 34494 | 0 |
| B | 0 | 35280 | 0 |
| C | 0 | 40689 | 0 |
| D | 0 | 35605 | 0 |
| Mode SS | |||
|---|---|---|---|
| Quadrant | BADHDUFLAG | Total packets | Discarded packets |
| A | 0 | 338 | 0 |
| B | 0 | 338 | 0 |
| C | 0 | 338 | 0 |
| D | 0 | 338 | 0 |
| Quadrant | Total seconds | Saturated seconds | Saturation percentage |
|---|---|---|---|
| A | 16542 | 78 | 0.471527% |
| B | 16542 | 126 | 0.761697% |
| C | 16542 | 221 | 1.335993% |
| D | 16542 | 100 | 0.604522% |
Noise dominated data is calculated using 1-second bins in cleaned event files. If a bin has >2000 counts, and if more than 50% of those come from <1% of pixels, then it is considered to be noise-dominated and hence unusable.
| Quadrant | # 1 sec bins | Bins with >0 counts | Bins with >2000 counts | High rate bins dominated by noise | Noise dominated (total time) | Noise dominated (detector-on time) | Marked lightcurve |
|---|---|---|---|---|---|---|---|
| A | 20357 | 16545 | 9 | 9 | 0.04% | 0.05% |  |
| B | 20357 | 16545 | 18 | 18 | 0.09% | 0.11% | 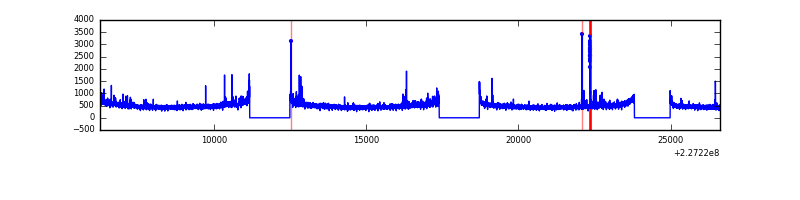 |
| C | 20357 | 16545 | 76 | 76 | 0.37% | 0.46% |  |
| D | 20357 | 16545 | 59 | 59 | 0.29% | 0.36% |  |
Top three noisy pixels from each quadrant. If the there are fewer than three noisy pixels in the level2.evt file, extra rows are filled as -1
| Pixel properties | Quadrant properties | ||||||
|---|---|---|---|---|---|---|---|
| Quadrant | DetID | PixID | Counts | Sigma | Mean | Median | Sigma |
| A | 0 | 128 | 69335 | 168.17 | 1994 | 1956 | 400.7 |
| A | 15 | 239 | 41229 | 98.02 | 1994 | 1956 | 400.7 |
| A | 8 | 15 | 31057 | 72.63 | 1994 | 1956 | 400.7 |
| B | 4 | 173 | 82111 | 211.8 | 2032 | 1984 | 378.3 |
| B | 10 | 16 | 67559 | 173.34 | 2032 | 1984 | 378.3 |
| B | 4 | 239 | 53585 | 136.4 | 2032 | 1984 | 378.3 |
| C | 1 | 16 | 2327224 | 5136.04 | 1976 | 1988 | 452.7 |
| C | 12 | 4 | 38368 | 80.36 | 1976 | 1988 | 452.7 |
| C | 13 | 61 | 15183 | 29.15 | 1976 | 1988 | 452.7 |
| D | 1 | 52 | 348236 | 735.35 | 1954 | 1901 | 471.0 |
| D | 4 | 95 | 149747 | 313.91 | 1954 | 1901 | 471.0 |
| D | 2 | 234 | 50128 | 102.4 | 1954 | 1901 | 471.0 |
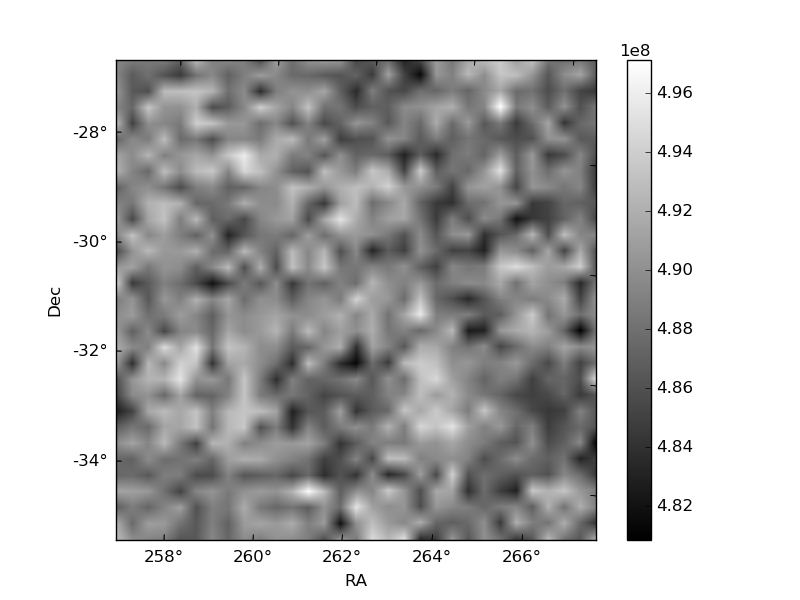
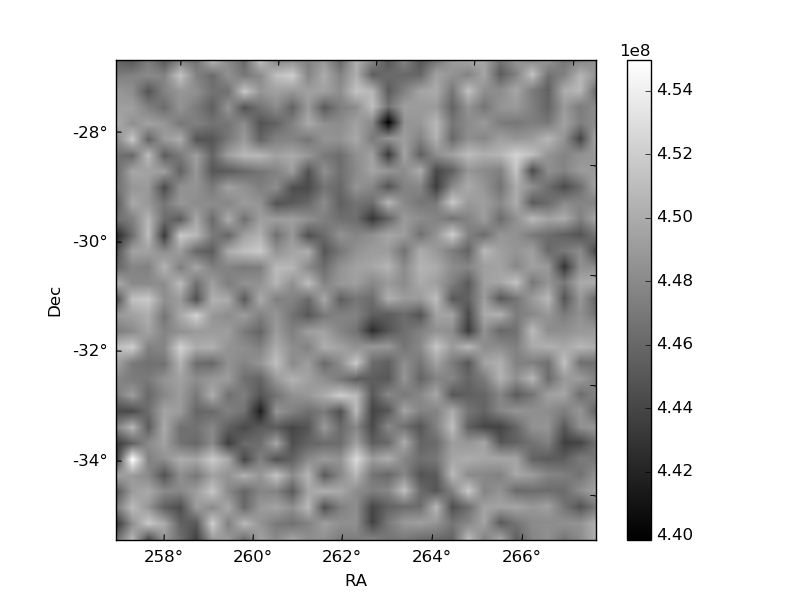
Histogram calculated using DETX and DETY for each event in the final _common_clean file
| Quadrant A |  |
 |
Quadrant B |
|---|---|---|---|
| Quadrant D |  |
 |
Quadrant C |
| Plot type | Count rate plots | Images |
|---|---|---|
| Comparison with Poisson distribution Blue bars denote a histogram of data divided into 1 sec bins. Red curve is a Poisson curve with rate = median count rate of data. |
 |
 |
| Quadrant-wise count rates Data is divided into 100 sec bins |
 |
|
| Module-wise count rates for Quadrant A Data is divided into 100 sec bins |
 |
 |
| Module-wise count rates for Quadrant B Data is divided into 100 sec bins |
 |
 |
| Module-wise count rates for Quadrant C Data is divided into 100 sec bins |
 |
 |
| Module-wise count rates for Quadrant D Data is divided into 100 sec bins |
 |
 |
| Parameter | Plot |
|---|---|
| CZT HV Monitor |  |
| D_VDD |  |
| Temperature 1 |  |
| Veto HV Monitor |  |
| Veto LLD |  |
| Alpha Counter |  |
| _CPM_Rate |  |
| CZT Counter |  |
| +2.5 Volts monitor | 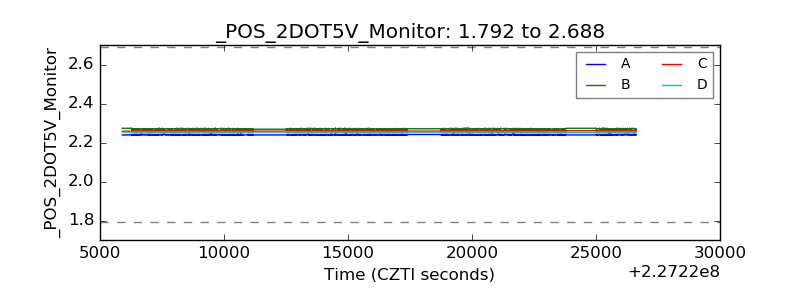 |
| +5 Volts monitor |  |
| _ROLL_ROT |  |
| _Roll_DEC |  |
| _Roll_RA | 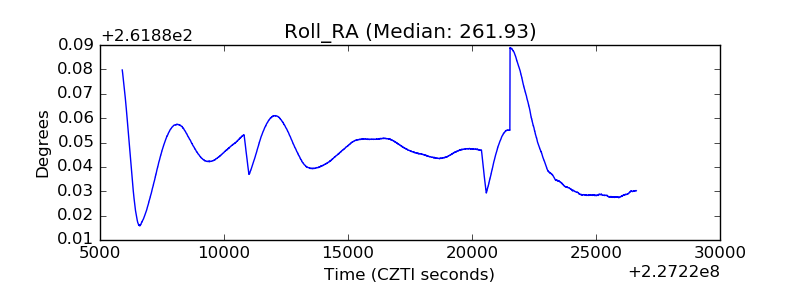 |
| Veto Counter |  |